Canary Deployment with Automated Rollback
With over 40 microservices and a fast-paced release cycle, Headout required a reliable, developer-friendly deployment strategy. We integrated Argo Rollouts into our internal platform service to enable one-click canary deployments, automatically catching faulty releases without manual intervention.

Headout is powered by more than forty microservices at its core, and given that we push new features at a rapid pace, using a basic rolling deployment was not sustainable in the long run.
With Kubernetes deployment, we were dependent on developers to monitor the metrics and revert the faulty deployments. Considering the amount of money we could potentially lose out on due to an extra minute of downtime, using a canary deployment with proper rollback was the way forward for us.
Canary deployment
Canary deployment is a progressive rollout strategy where traffic is gradually shifted from the existing version of an application to a new version, allowing controlled testing before full deployment. It enables a subset of users to access the new version first, helping identify potential issues before a wider release. This approach minimizes risk by ensuring that only a small portion of traffic is impacted initially, with the ability to roll back if needed.
Tools explored
In our pursuit of an effective progressive delivery solution, we evaluated these three tools. After careful consideration, we chose Argo Rollouts for its seamless integration with our existing technologies and its straightforward implementation.
Why we chose Argo Rollouts
- Seamless integration with Istio
Since Istio is our service mesh, finding a solution that integrates effortlessly was crucial. Argo Rollouts proved to be the perfect choice, offering advanced traffic management during deployments without adding unnecessary complexity.
- GitOps compatibility
Designed with GitOps principles in mind, Argo Rollouts integrates smoothly with Argo CD, facilitating declarative and version-controlled deployment strategies.
- Simplicity and ease of use:
Argo Rollouts is a user-friendly system which requires minimal setup, reducing operational complexity and enhancing developer productivity.
Implementation
Low-Level Overview (LLD)
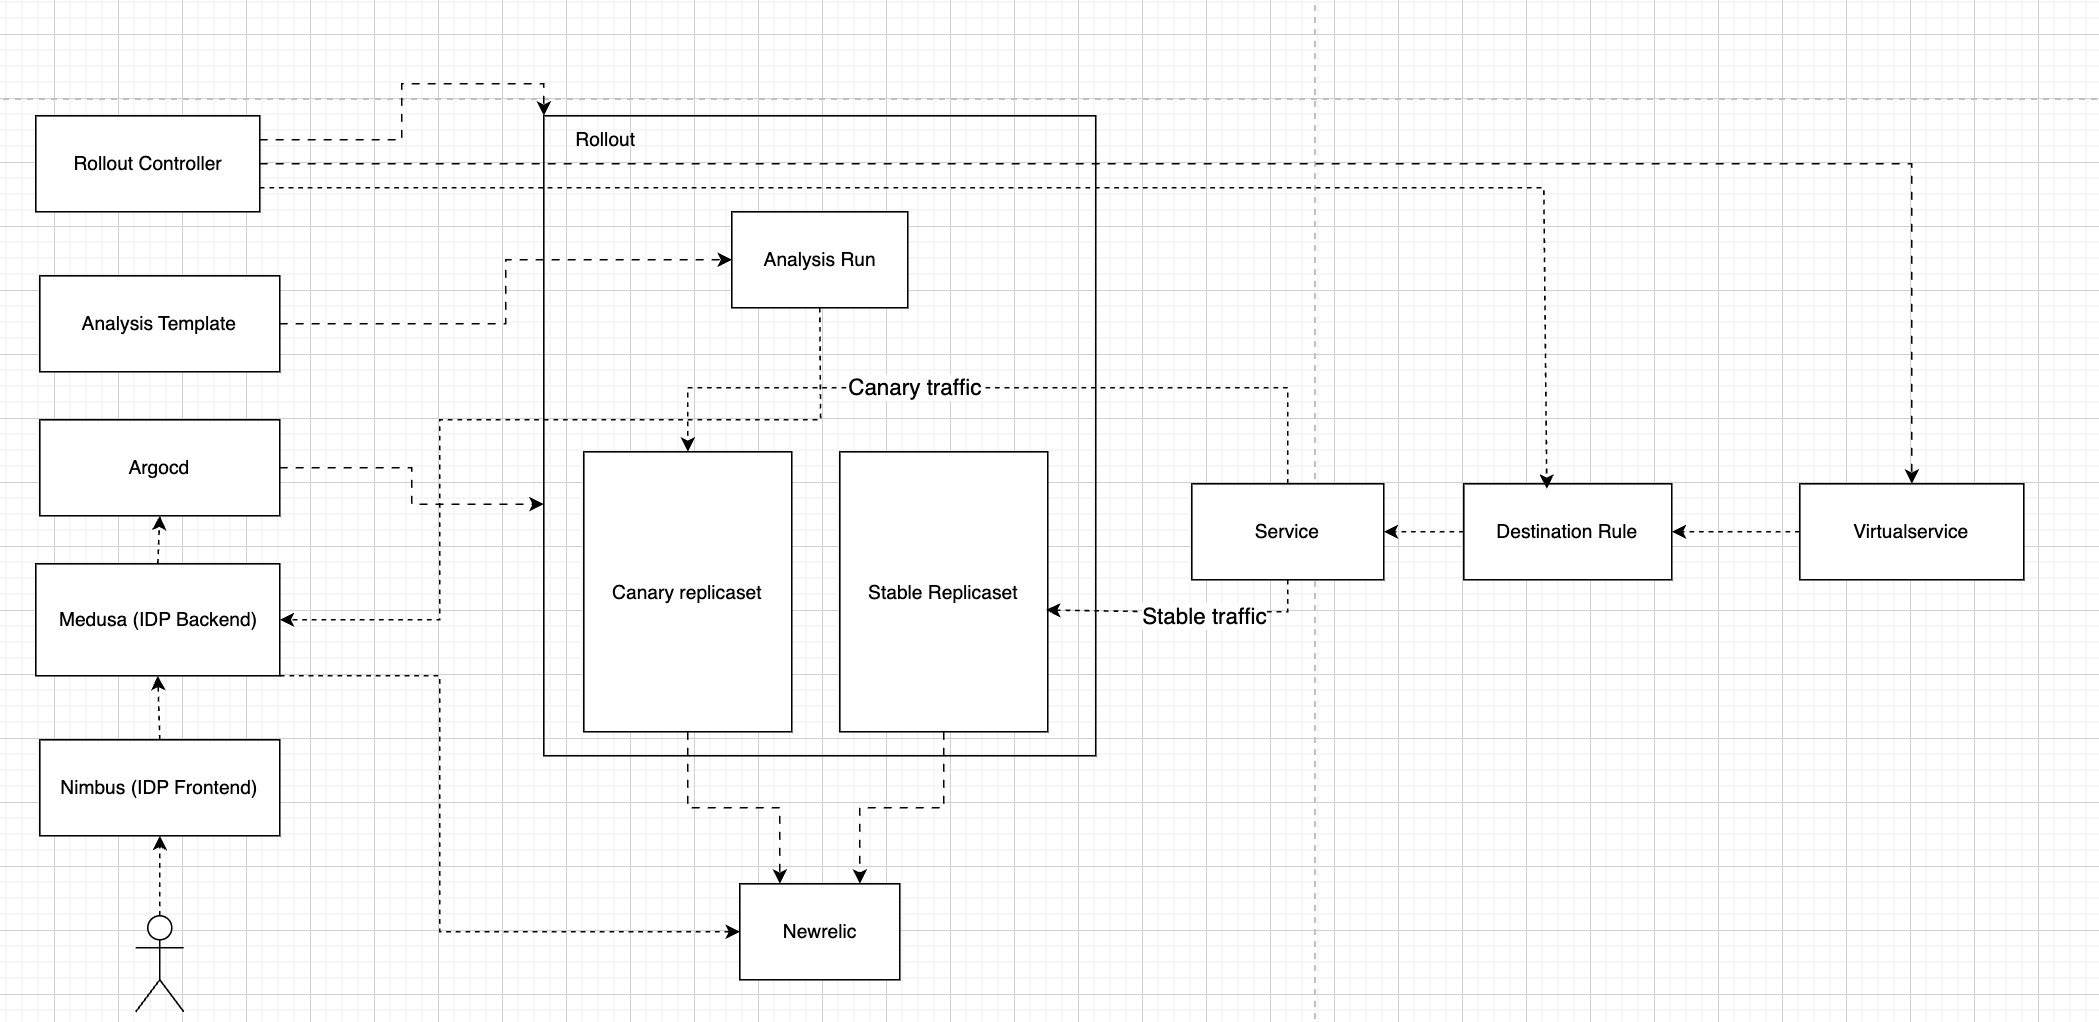
Argo Rollouts handles the deployment of new versions in a canary strategy. The rollout controller modifies the virtual service weights, destination rule labels, and creates new canary replicas accordingly. This controller was installed in our cluster to manage the rollouts.
The analysis template handles the configurations required to monitor the application’s error rate during the deployment process. It is used to create analysis runs between rollout phases, during which relevant error metrics are calculated. We implemented this by creating separate analysis templates with specific metric thresholds tailored for each service.
Newrelic is the application monitoring tool used in our system for tracking application performance, identifying bottlenecks, and ensuring overall system health. It provides real-time insights into metrics such as response times, error rates, and throughput.
- Rollback mechanism
The rollback mechanism automatically triggers a rollback if the error rate exceeds the predefined threshold. This process is handled internally by the rollout controller, which reverts the deployment if an analysis run fails based on the rollback metrics.
- Nimbus, Medusa integration
Nimbus is our frontend service used by developers to deploy application versions and Medusa is the backend service powering it. We are handling deployment using argocd APIs to update version during a deployment call.
- Dynamic strategy management
Argo rollouts did not provide an API to change the strategies dynamically. Switching the rollout strategy using Kubernetes API directly was not an ideal approach for us since it deviated from GitOps principle. To handle the strategies without any manual changes, we leveraged our Medusa service to manipulate helm parameters added in argocd application manifest to switch strategies during a deployment call.
- Deployment options
These base helm parameters were added to all our argocd application manifests. When a developer calls UpdateApplicationVersion API from our service, we trigger the update of image tag along with the canary parameters to ensure proper strategy is followed.
   parameters:
      - name: image.tag
        value: latest
      - name: rollout.customCanary.enabled
        value: 'false'
      - name: rollout.customCanary.percentage
        value: '0'
      - name: rollout.overrideCanary
        value: 'false'
Helm parameters are used to switch the rollout strategies in our rollout helm chart template at runtime to ensure proper strategy is followed with each api call.
{{- if .Values.rollout.overrideCanary }}
steps:
  - setWeight: 100
  - pause:
      duration: 30s
{{- else if and .Values.rollout.customCanary.enabled (ge (int .Values.rollout.customCanary.percentage) 0) }}
  {{- if eq (int .Values.rollout.customCanary.percentage) 0 }}
steps:
  - setCanaryScale:
      replicas: 1
  - pause:
      duration: 2m
  {{- else }}
steps:
  - setCanaryScale:
      matchTrafficWeight: true
  - setWeight: {{ int .Values.rollout.customCanary.percentage }}
  - pause:
      duration: 2m
  {{- end }}
  {{- if .Values.analysisTemplate }}
  - analysis:
      templates:
        - templateName: {{ include "headout.fullname" . }}
  {{- end }}
  {{- if ne (int .Values.rollout.customCanary.percentage) 100 }}
  - pause:
      duration: 168h
  {{- end }}
{{- else }}
steps: {{ toYaml .Values.rollout.steps | nindent 6 }}
{{- end }}
We had to provide three deployment strategies to our developers from our service - Default Canary, Custom Canary and Override Canary.
- Default canary
For regular feature deployments, a preconfigured strategy with standard error checks suffices. We are configuring the default canary rollout stages in our values file for each application.
  steps:
    - setWeight: 10
    - pause: {duration: 120}
    - analysis:
        templates:
          - templateName: headout-service
    - setWeight: 50
    - pause: {duration: 120}
    - analysis:
        templates:
          - templateName: headout-service
    - setWeight: 100
We deploy applications in three routing stages, gradually increasing the canary percentage while performing error checks. After each routing update, there's a 2-minute pause to collect sufficient data in New Relic for the new canary pods.
- Custom canary
For large-scale changes, we provide developers with a method to manually select deployment percentages in Nimbus frontend, which is accompanied by automated error checks. This approach allows developers to monitor deployments and adjust the canary percentage as needed. Helm parameters are updated to set the rollout.customCanary.enabled parameter to true and specify the desired canary percentage using rollout.customCanary.percentage.
- Zero traffic canary
steps:
  - setCanaryScale:
      replicas: 1
  - pause:
      duration: 168h
This strategy involves launching a single pod with the new image tag, without routing any traffic to the canary version.
- Custom canary with percentage greater than zero
steps:
  - setWeight: 10
  - pause: {duration: 120}
  - analysis:
      templates:
      - templateName: headout-service
  - pause: {duration: 168h}
This strategy involves routing a specific percentage of traffic to canary pods, allowing developers to monitor performance.
- Override canary
Helm parameter are be updated to set rollout.overrideCanary as true which will update the rollout strategy to the value given below.
steps:
  - setWeight: 100
  - pause:  {duration: 30}
This strategy ensures a rapid rollout by directing 100% of traffic to the canary pods once they are booted up. It is typically used by developers to deploy quick hotfixes or changes that are not backward compatible, where a gradual rollout is either unnecessary or could cause inconsistencies.
- Notification system
Argo Rollouts notification system couldn't handle all our notification use cases directly, such as Slack notifications with dynamic tags. To address this, we utilize the Argo Rollouts notification service in conjunction with our platform's backend service URL as a webhook. This setup enables the creation of notifications based on various conditions, leveraging information stored within our platform's backend storage layers.
- Error analysis
While AnalysisTemplates in Argo Rollouts can integrate with various monitoring tools for error calculations, our complex requirements necessitate a different approach. Instead of relying solely on direct AnalysisTemplates, we utilize our platform's backend service API to perform intricate error analyses, ensuring accurate assessments aligned with our specific needs.
Error metrics
Selecting a reliable rollback metric was crucial for this project. The chosen metric needed to be dependable, with a minimal false positive rate.
General error threshold
Initially, we employed the total error metric of an application during the canary rollout phases. Rollback decisions were made by comparing the application's error metric during the canary phase to the previous hour's error rate, applying a fixed threshold. This approach aimed to mitigate external factors that could trigger unnecessary rollbacks. However, this method presented challenges, leading to false positive rollbacks. The total error rate was often skewed by factors such as spam attacks coinciding with deployment times, misconfigured error logs, and other issues unrelated to the new version changes.
analysisTemplate:
  labels:
    environment: production
  metrics:
    - name: error-percentage
      successCondition: >-
        result.errorPercentageTwoMinute != nil &&
        result.errorPercentageThirtyMinute != nil &&
        (result.errorPercentageTwoMinute <= 2 || result.errorPercentageTwoMinute
        <= result.errorPercentageThirtyMinute )
      failureCondition: >-
        (result.errorPercentageTwoMinute == nil ||
        result.errorPercentageThirtyMinute == nil ||
        (result.errorPercentageTwoMinute > 2 && result.errorPercentageTwoMinute
        > result.errorPercentageThirtyMinute))
      provider:
        newRelic:
          query: |
            SELECT
              percentage(count(*), WHERE error IS true) AS errorPercentageTwoMinute,
              (SELECT percentage(count(*), WHERE error IS true) FROM Transaction WHERE appName = 'production-athena' SINCE 30 minutes ago) AS errorPercentageThirtyMinute
            FROM Transaction
            WHERE appName = 'production-athena'
            SINCE 2 minute ago
Error difference
To reduce false positive rollbacks, we adopted a new metric that calculates the error difference between canary and stable pods, comparing it against a predefined threshold. This approach effectively filters out issues like spam attacks and misconfigured error logs that are unrelated to the new version. Assuming uniform traffic distribution across pods, each pod is expected to handle requests without significant skew in individual APIs.
We implemented this by utilizing the host attribute in New Relic error logs, which corresponds to the Kubernetes pod name. By storing the pod template hash of new canary replicaset, we could execute error queries during error analysis API calls. Due to the limitations of the AnalysisTemplate in handling this query directly, we integrated this functionality into our backend service, enabling API calls during the analysis run.
// Individual query used for each pod template hash (stable, canary)
queryString := fmt.Sprintf(`
	SELECT
	  percentage(count(*), WHERE error IS true)
	FROM Transaction
	WHERE appName = '%s'
	  AND host LIKE '%%%s%%'
	SINCE 2 minutes ago`, newrelicServiceName, podTemplateHash)

query := nrdb.NRQL(queryString)

response, err := c.Client.Nrdb.QueryWithContext(ctx, c.AccountID, query)
if err != nil {
	return 0, fmt.Errorf("failed to execute query: %v", err)
}
Accessing canary
After integrating canary deployments into our infrastructure, we received requests to directly access the canary version via a browser for testing purposes or to invoke specific backend operations, such as cache creation, on the new canary pods.
To accommodate this, we implemented query parameter-based routing rules at the top of all VirtualServices in our rollout system. This configuration allows us to use a query parameter to direct traffic specifically to canary or stable pods for testing.
This setup enables direct access to canary pods during deployments, facilitating thorough testing before full production rollout.
  http:
    - match:
        - queryParams:
            canaryVersion:
              regex: .+
      name: headout-service-canary-queryParam-route
      route:
        - destination:
            host: headout-service
            port:
              number: 80
            subset: canary
          weight: 100
    - match:
        - queryParams:
            stableVersion:
              regex: .+
      name: headout-service-stable-queryParam-route
      route:
        - destination:
            host: headout-service
            port:
              number: 80
            subset: stable
          weight: 100
Making it developer friendly
With the integration of canary deployments and automated rollbacks, it is essential to keep developers informed throughout the deployment process and ensure an end-to-end self-service setup.
- Rollout event notifications
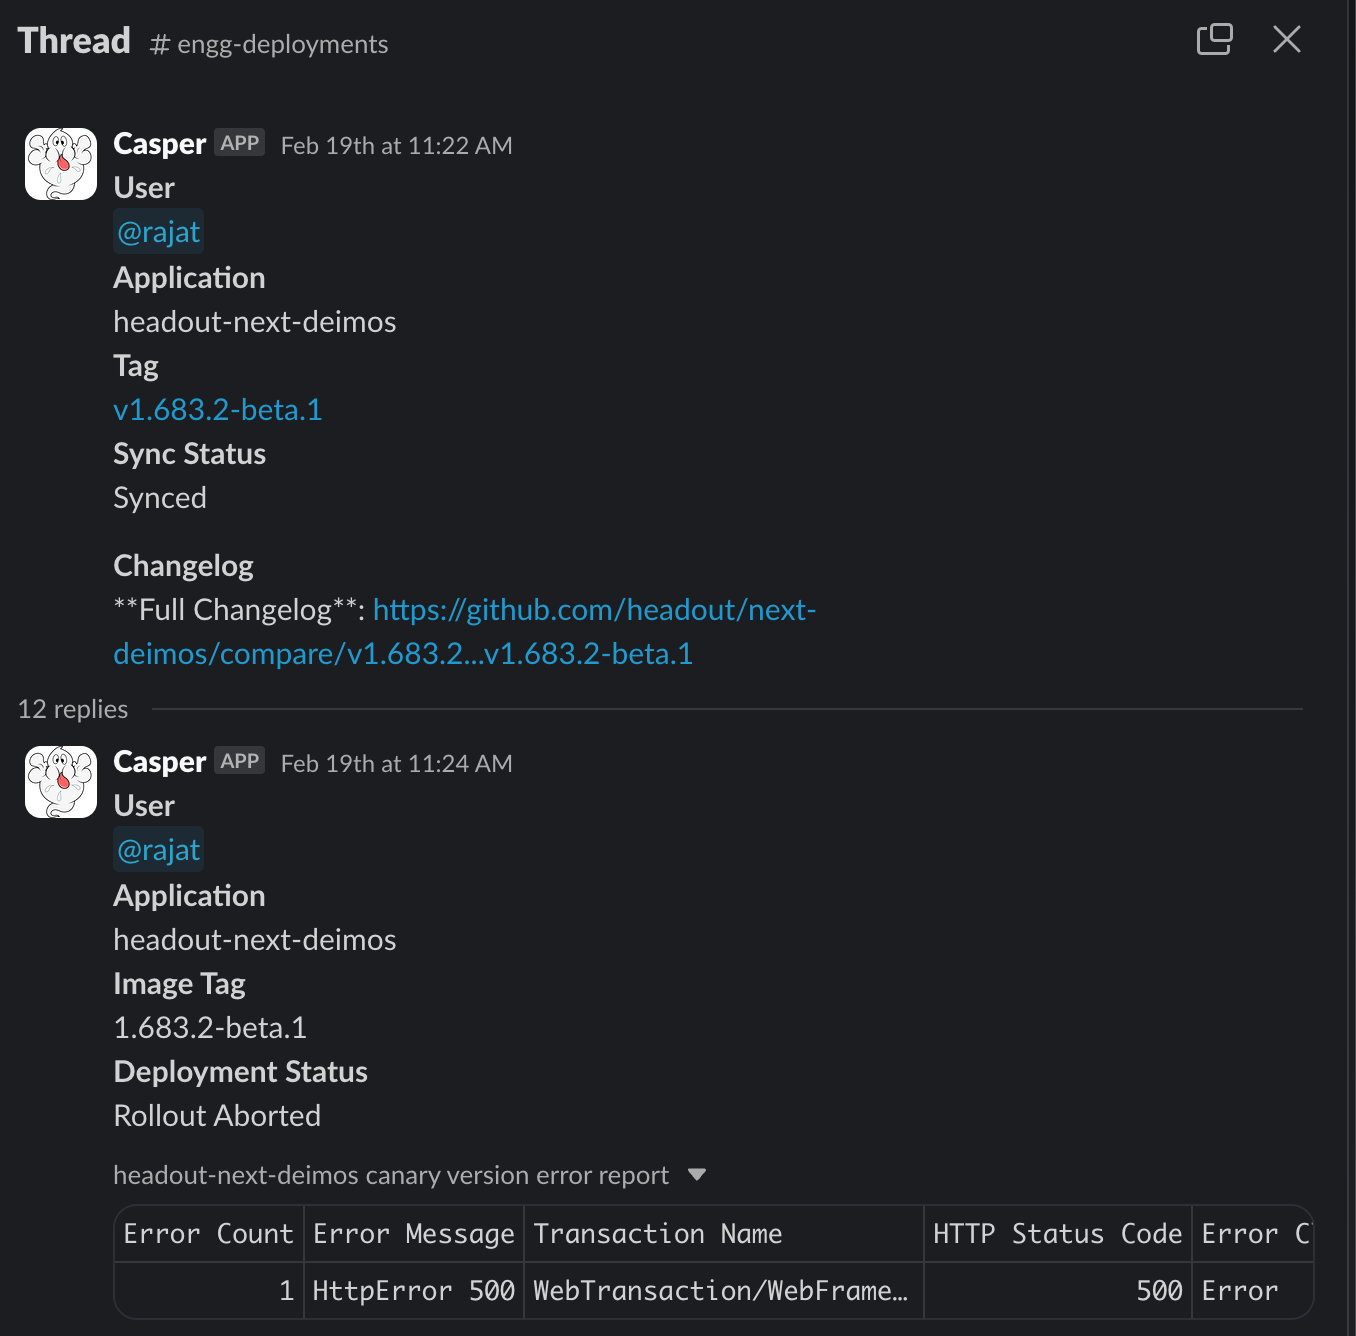
Our critical applications go through multiple canary routing phases, extending the overall deployment duration compared to our previous setup. To keep developers updated, we integrated event notifications using our Slack notification platform. Argo Rollouts was configured with a webhook URL pointing to our platform backend, which sends notifications for rollout completions and aborts, tagging the engineer responsible for the deployment.
- Error analysis results
When an analysis run fails, we generate a summary highlighting errors observed in the canary ReplicaSet, along with error attributes that help developers quickly pinpoint and debug issues. These results are sent along with rollout aborted events, retrieved via a query to the New Relic API, and formatted into a CSV for easier review.
- Argo Rollout extension
Argo Rollouts provides an extension for Argo CD deployments, allowing developers to visualize rollout phases and directly manipulate rollouts via the Argo CD UI. This extension enables direct operations on rollouts without requiring manual CLI interventions.
Success metrics
We evaluated the project's success using two key metrics:
- Identifying faulty releases –
100%
Our canary and rollback system successfully intercepted three defective production releases. While this number may seem modest, achieving zero faulty releases post-implementation of our refined error metrics is a huge win for us.
- Reducing false positive rollbacks –
1 false rollback/week
Although it's challenging to eliminate false positives entirely due to edge cases such as low RPM service errors or specific failing APIs being routed exclusively to canary pods, we've made good progress. Transitioning from a total error rate metric to evaluating error differences has reduced false positive rollbacks from five per week to just one.
Future plans
Our current implementation utilizes a small subset of Argo Rollouts capabilities. As our scale grows and requirements evolve, we plan to incorporate additional features into Nimbus to enhance developer experience and deployment efficiency.
- Traffic mirroring
Implementing traffic mirroring will enable us to replicate live traffic to canary pods, ensuring safer validation without affecting users. It will also assist in debugging by reproducing different traffic scenarios across different versions.
- Experimentation
Leveraging experiment feature will enable controlled testing of multiple versions simultaneously to analyze performance and gather insights.
- Header-based routing
Using Argo Rollouts with Istio’s header-based routing will allow us to direct specific user segments to different application versions for targeted testing and gradual rollouts.
Conclusion
Argo Rollouts, integrated with our Nimbus and Medusa setup, has significantly streamlined deployments by facilitating safer canary releases and minimizing downtime. By reducing false positives and preventing faulty releases, it has enhanced our deployment reliability. Moving forward, we aim to further improve our process by incorporating additional Argo Rollouts features into our regular workflow and enhance the resilience of our deployment pipeline with advanced error detection strategies to proactively address potential issues.