Are your maps helping users in maki-ng informed decisions?
Picture this: You're tucked into bed, mentally preparing for your big trip to Japan tomorrow afternoon. You glance at your checklist one last time and realize you've missed something crucial - Mt. Fuji! You've dreamed of seeing it while soaking in a hot spring, and

Picture this: You're tucked into bed, mentally preparing for your big trip to Japan tomorrow afternoon. You glance at your checklist one last time and realize you've missed something crucial - Mt. Fuji! You've dreamed of seeing it while soaking in a hot spring, and again with the siren-red roof of a pagoda peeking in from the right.

You're exhausted from planning, preparing, and packing. Still, you muster the energy to go online for a quick search. But then you're faced with a dilemma:
Which tour should you pick?
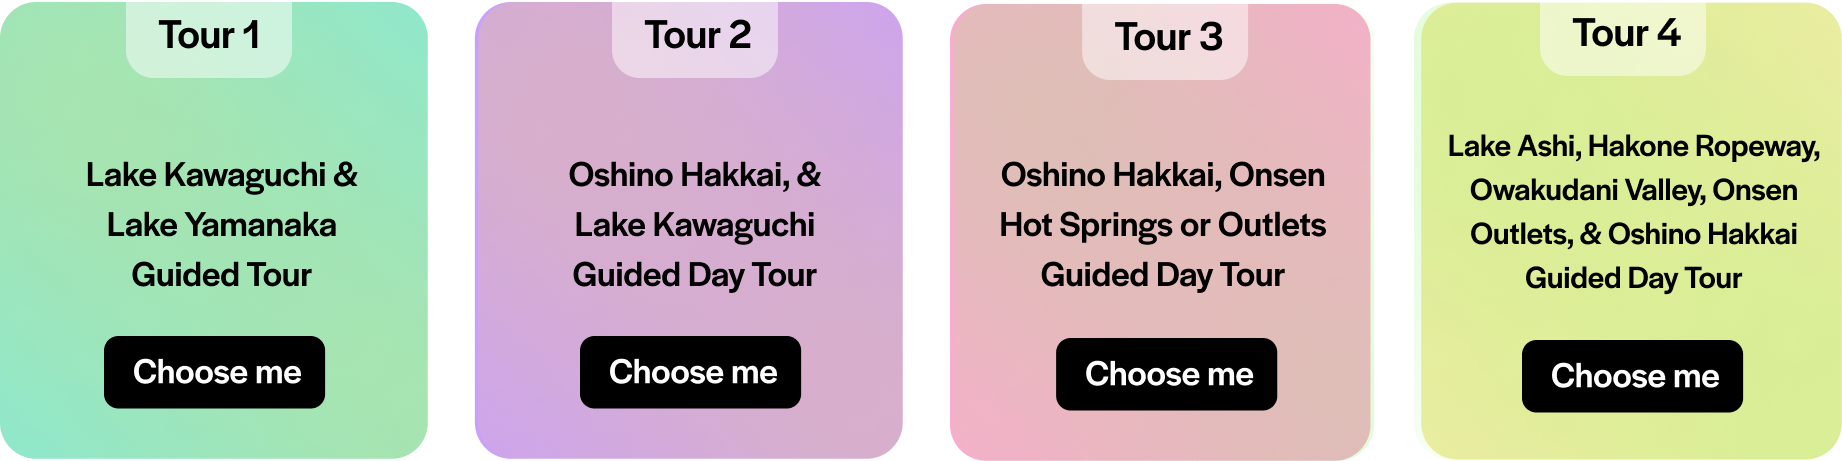
In A1., you neither have enough context nor the time to realistically make an educated choice with the information given above. You're more likely to make no choice at all.
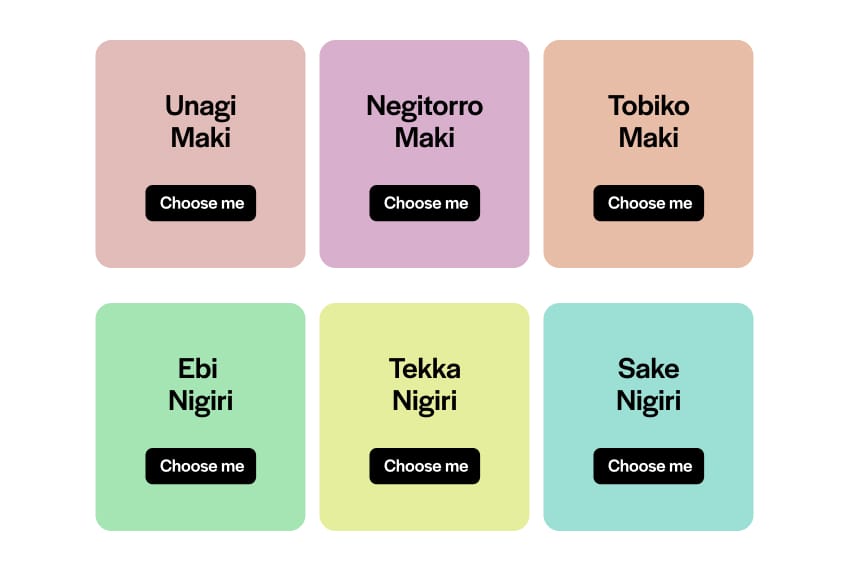
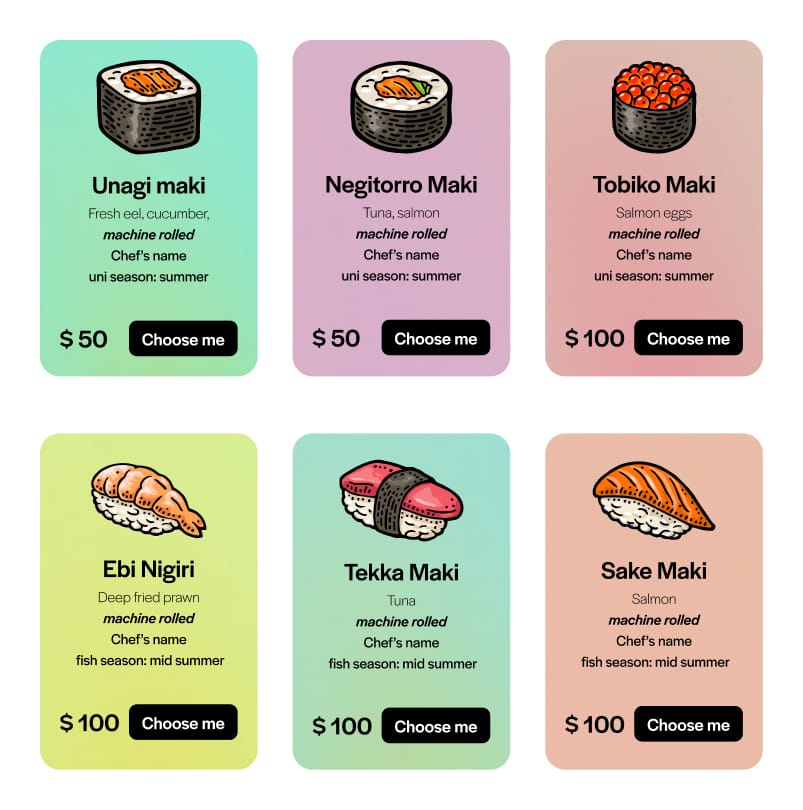
It's not very different from being given a sushi menu (A.2.) with Japanese names (assuming you don't know Japanese too well) and no explanation when you’re starving.
Decision paralysis occurs when not enough/right type of information is given. In this moment of decision paralysis, you find yourself longing for clarity - a bird's eye view of your options. This is where the art and science of information design intersects with our cognitive limitations. Our brains are wired to process visual information rapidly.

In the time it takes to read a single word, your mind can already grasp the essence of an entire image. This evolutionary advantage once helped us spot predators in the wild; now, it helps us navigate the dense jungles of information in our modern world.
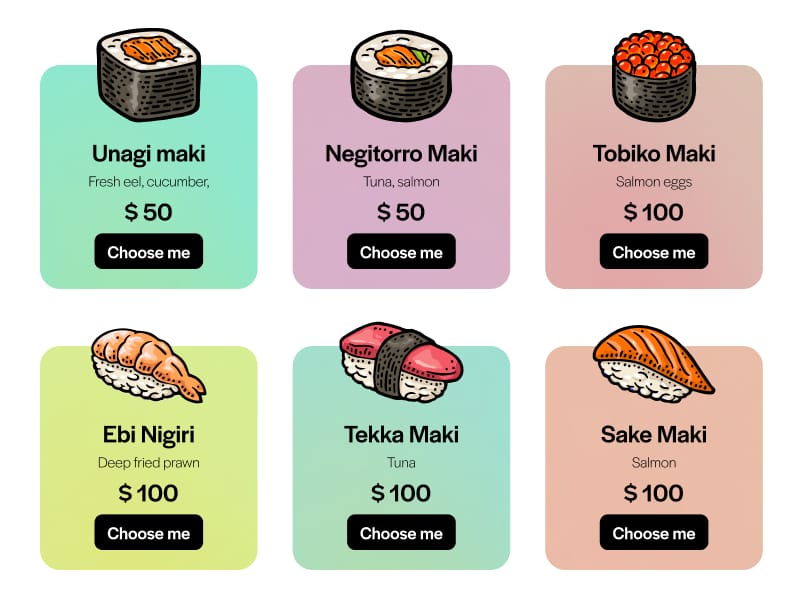
Quick decisions are made when there's a clear understanding of what the main factors are for decision making. When the factors that you need are clearly presented to you, it's easy to make a decision. For example, while looking at the menu below in (A.3), you can compare factors like price, ingredients and visual appeal.
But the other extreme of that spectrum can lead to decision fatigue. Decision fatigue occurs when given too much information at once, especially information that isn't important or relevant to your main decision making.
Take a gander at the menu below in (A.4). Some genius thought it'd be a great idea to include the chef's entire LinkedIn profile and the fish's zodiac sign. Suddenly, you're not just picking dinner; you're solving a culinary escape room. "Do I want the Sagittarius salmon rolled by Chef Tanaka, who once won a origami competition, or the Pisces tuna prepared by Chef Yamada, who moonlights as a haiku poet?" Great, now you have two more factors to chew on, and they're about as useful to your sushi selection as chopsticks are to soup.

Maki-ng Maps
Enter the map - not just a tool for geography, but a powerful cognitive shortcut. A well-designed map doesn't just show you where things are; it reveals relationships, highlights priorities, and guides decisions. In our Mt. Fuji dilemma, the right map could transform an overwhelming array of choices into an intuitive, visual journey.
By understanding based on what factors users make the choice to pick one tour over the other - a map can be designed to hel ease that process.
A map's true purpose
How can we harness the power of visual thinking to simplify complex decisions without losing crucial details?
While decision-making, cognitive load is a critical factor. When choosing between tour routes, there's a delicate balance between providing enough information to make an educated choice and overwhelming the decision-maker with extraneous details. The descriptions of localities or intricate transportation logistics, while valuable in their own right, can obscure the primary decision-making criteria at this stage.
This concept aligns with the principle of progressive disclosure in information design. Initially, we present only the most crucial information needed for a high-level decision. Once that primary choice is made, we can then unfurl the layers of more granular details, allowing for a deeper dive into the specifics of the chosen route.
This approach not only streamlines the decision-making process but also respects the cognitive resources of the user, ensuring that each stage of planning is met with the most relevant information, precisely when it's needed.
Which is why as a first step, I’ve learned to ask myself: what is the point of the map?
The decision
The essence of effective map-making lies in its adherence to a singular, overarching purpose. The decision. That's the main point.
This principle of hierarchical focus isn't merely an aesthetic choice; it's a cognitive necessity. The primary intent of a map should act as a gravitational center, with all other elements orbiting to support and reinforce this central purpose. This approach isn't about simplification for its own sake, but rather about optimizing the map's utility in facilitating decision-making or action.
Consider the stark contrast between an atlas and a navigation app - two cartographic tools with distinctly different cognitive functions. An atlas (B.1) serves as a spatial encyclopedia, a canvas that allows us to contextualize our place in the world. It invites contemplation of vast distances, geopolitical boundaries, and the physical barriers that separate us from far-flung destinations.
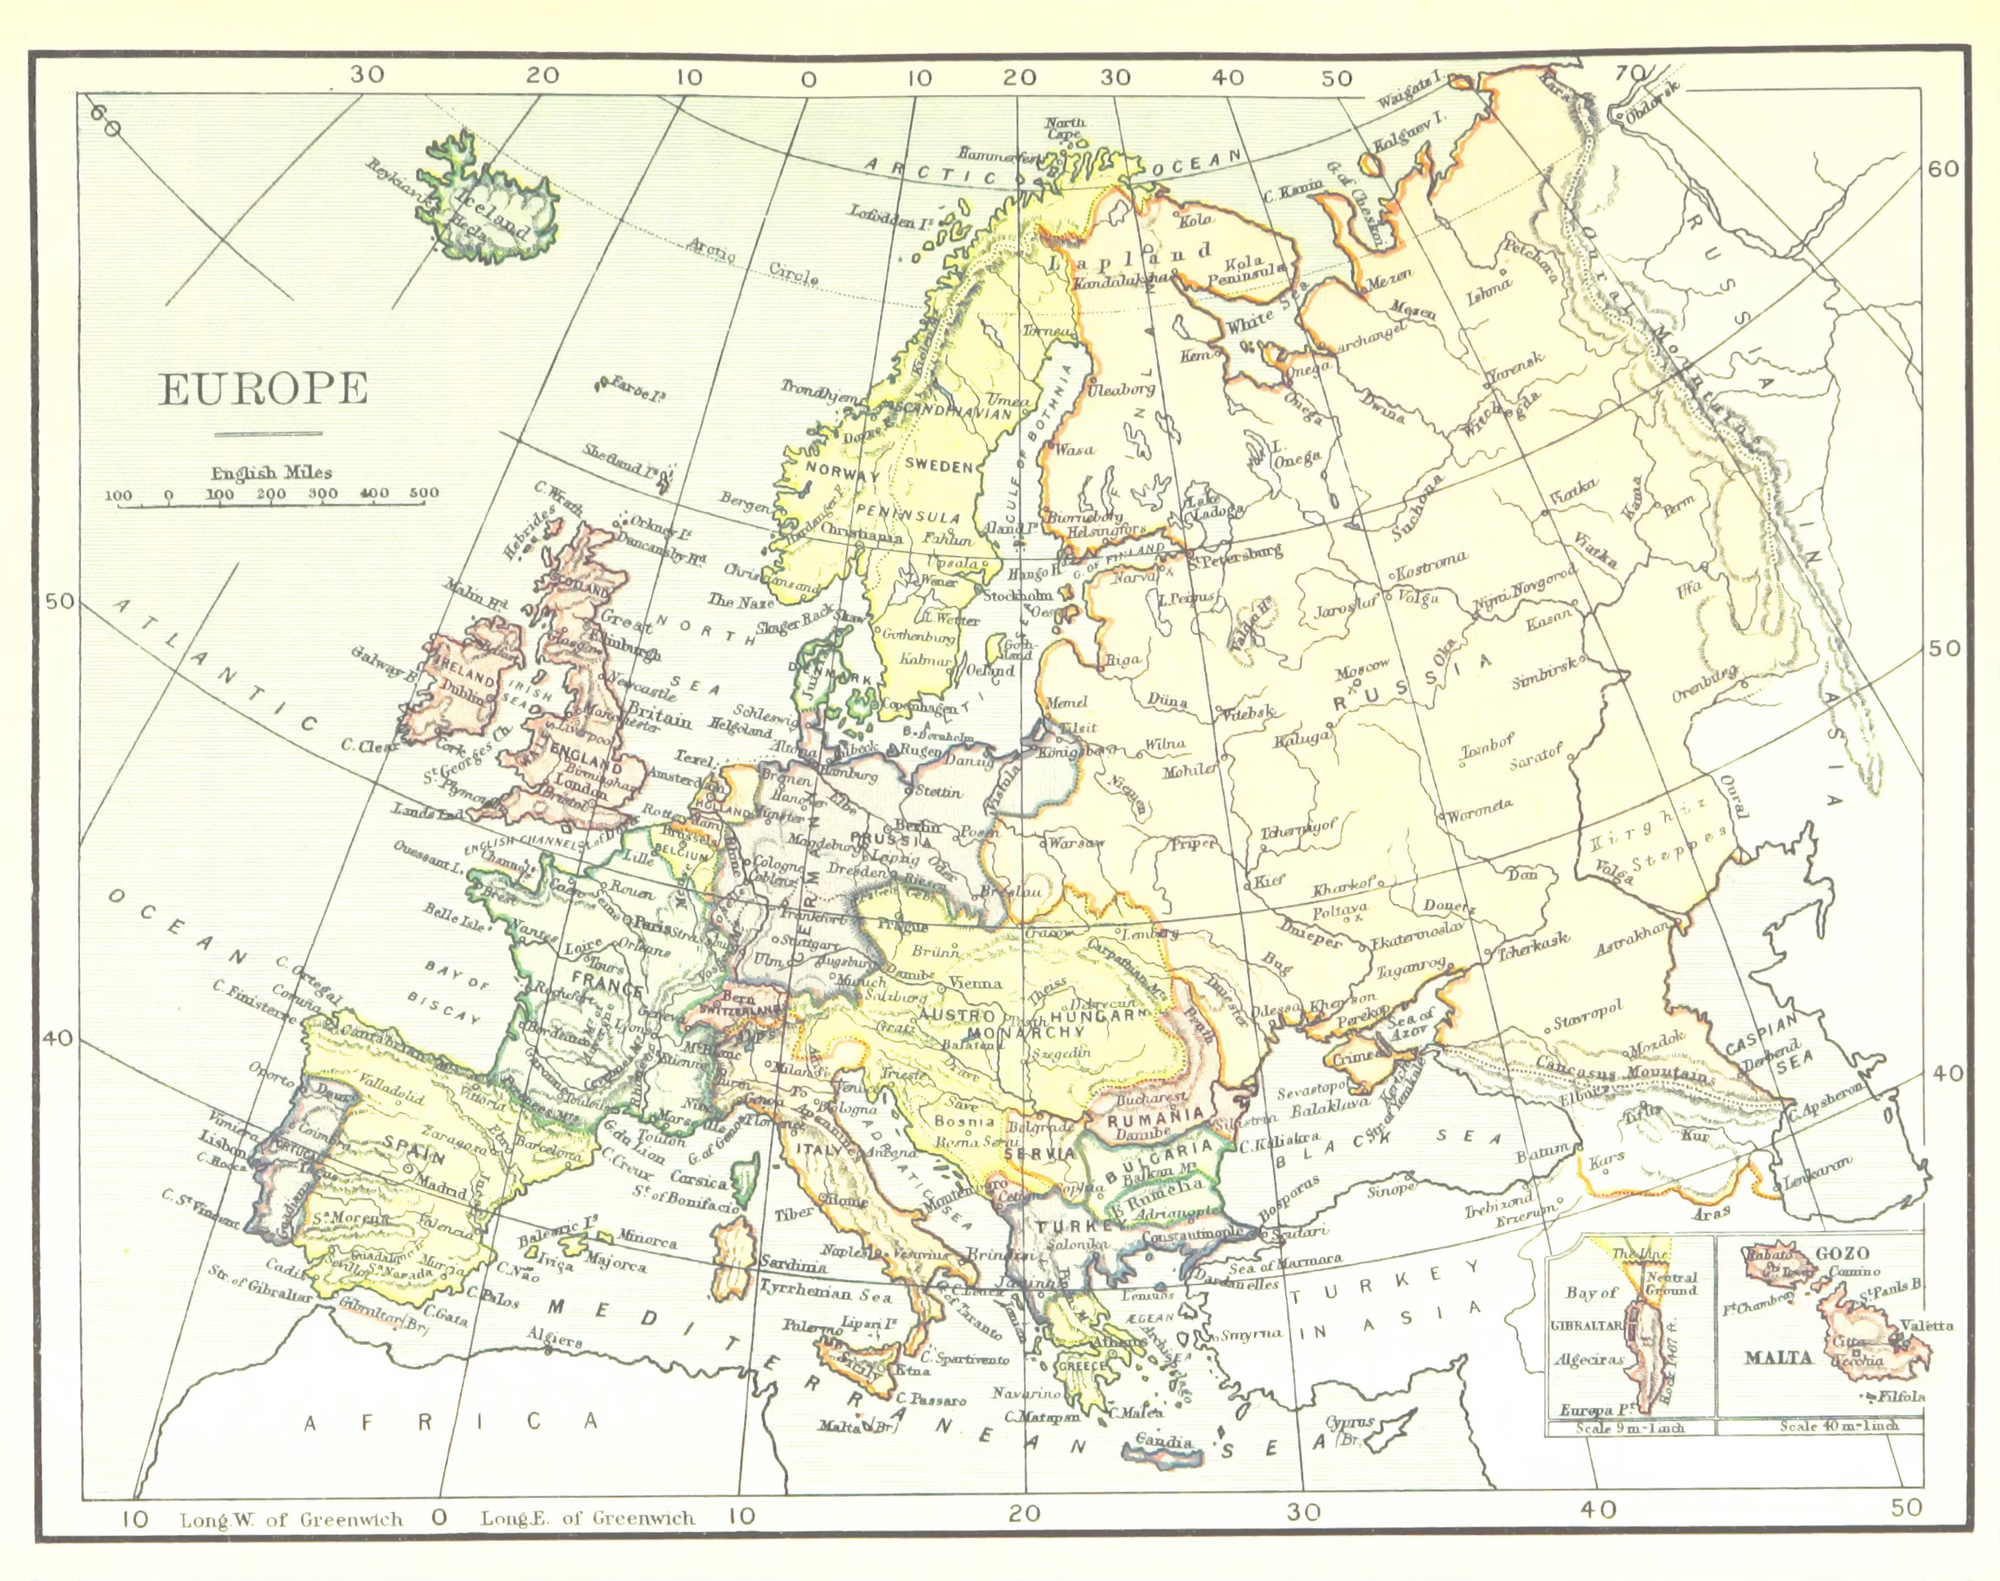
When you dream of Japan, an atlas helps you visualize the journey: the expanse of oceans to cross, the countries that lie between, and the sheer scale of your potential adventure. There is no big decision to be made here - it’s more poetic.
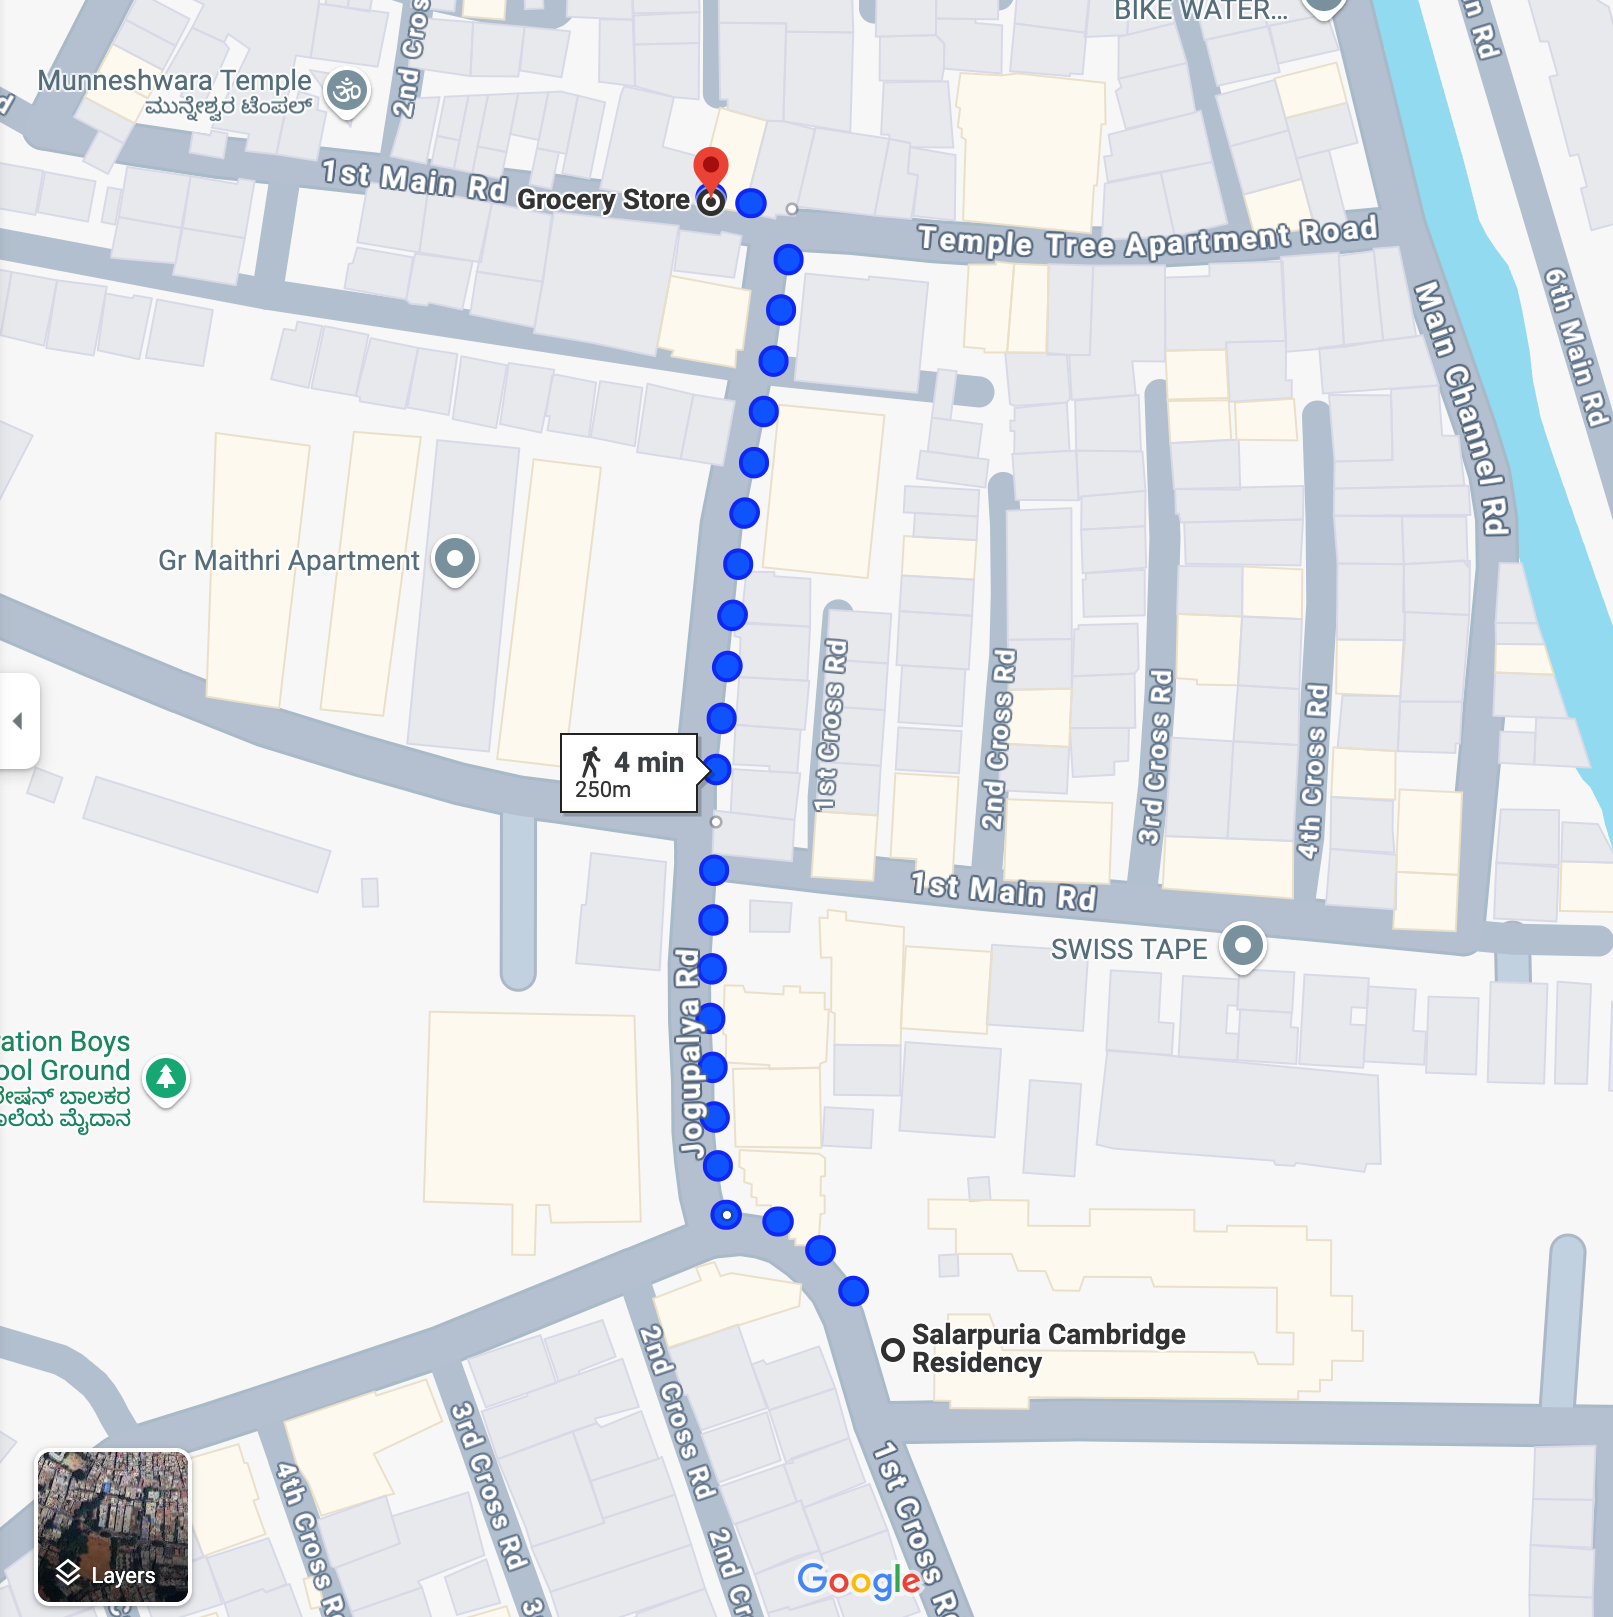
Conversely, a navigation app like Google Maps operates on a principle of immediate utility. It strips away the poetic aspects of geography to serve a singular, pressing need: how to get from point A to point B with maximum efficiency. When you're seeking the nearest convenience store (B.2), the app doesn't burden you with unnecessary information about the city's history or the architectural styles of buildings you'll pass. It cuts the crap, providing only what's essential for your immediate journey.
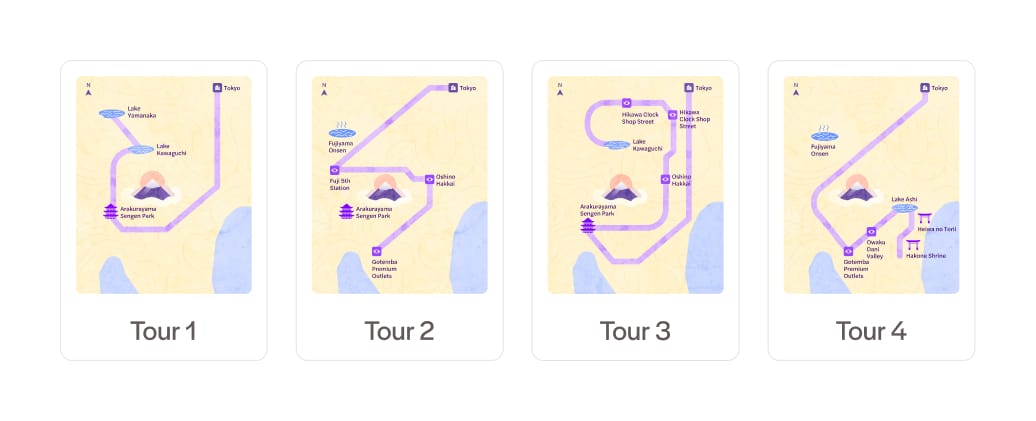
In the context of planning your Mt. Fuji tour, the ideal map would strike a balance between these extremes like in (B.3). It would prioritize the comparison of viewpoints, allowing you to weigh the merits of different vantage points without drowning in extraneous details. This map needs to focus on bare minimum details, perhaps using color coding or symbolic representation to distill complex information into easily comparable options.
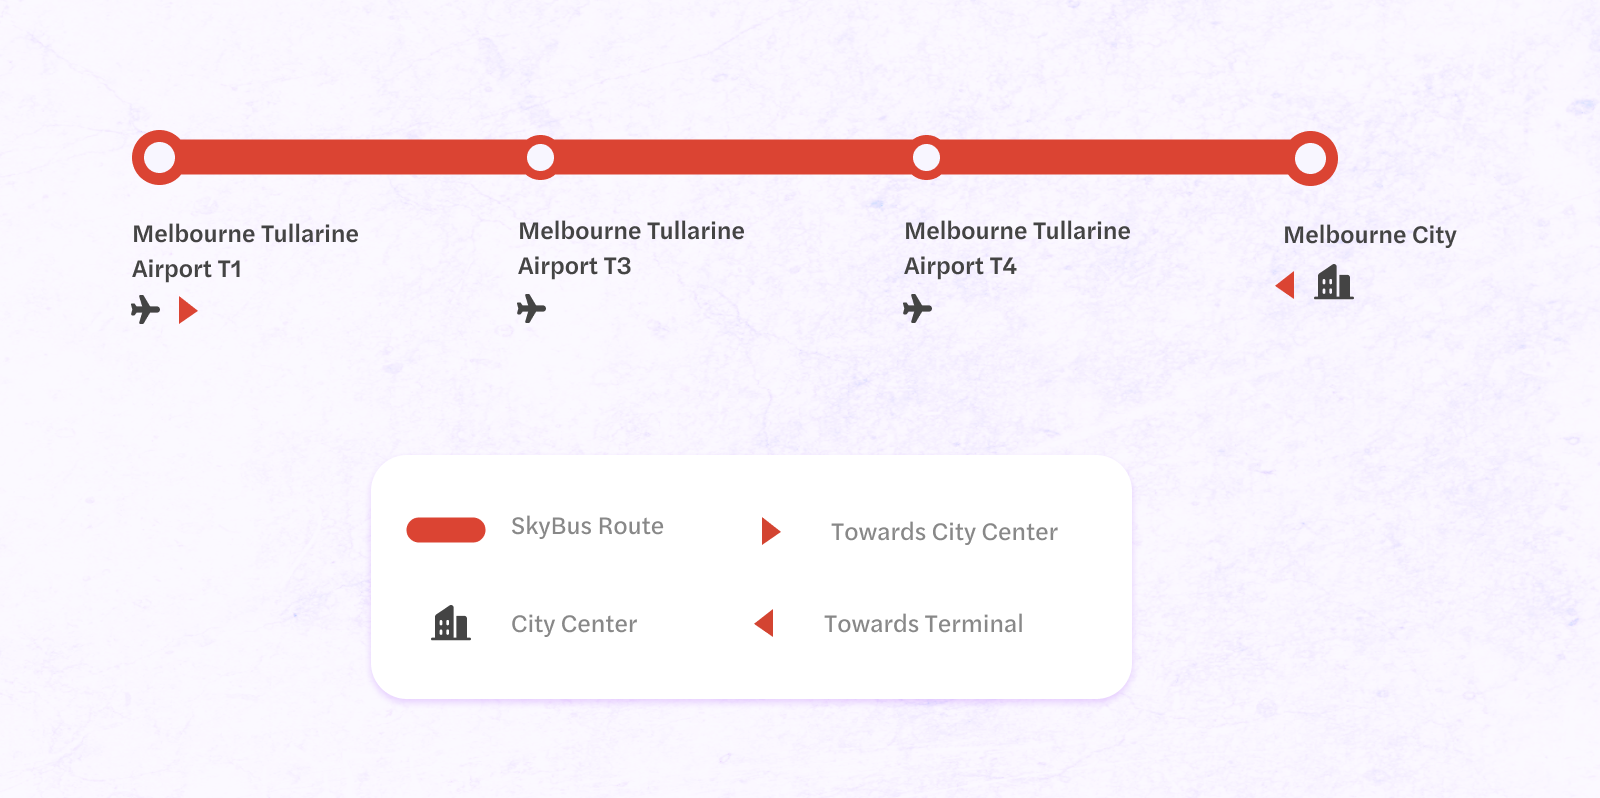
For simpler tasks, like understanding an airport transfer route, the map can be even more reductive. Here, the cartographic focus narrows to a simple path representation with chronological order of all stops, eschewing virtually all other geographic information that doesn't directly serve the purpose of getting you from the airport to your destination. (B.4)
This approach highlights the fact that the most effective map is one that aligns precisely with its intended cognitive function, whether that's inspiring global exploration, facilitating local navigation, or aiding in specific decision-making processes.
Rolling out the difference
While working on maps, my team noticed how the map in (C.1), the one we were using did not fulfil the cognitive purpose for our customers of being able to see the transportation options to get to the Montserrat Monastery. While it was appropriate for customers to use on ground to engage and interact with information around them, it’s not an ideal map to give you options that directly relate to products.
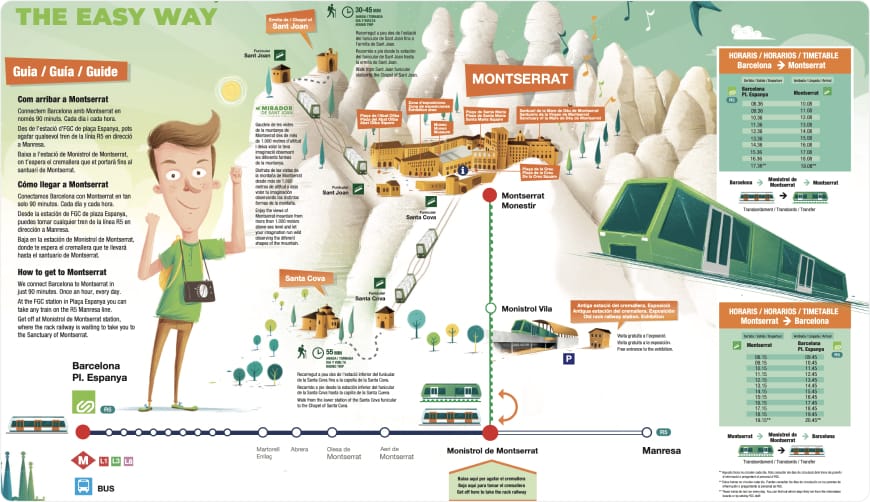
- It had excess information both in the form of text and visuals, that took more than 50% of the space
- The legibility of the text, especially in mobile did not pass
- There was no visual or information hierarchy
- It was difficult to understand available choices
- A singular, clear legend was missing
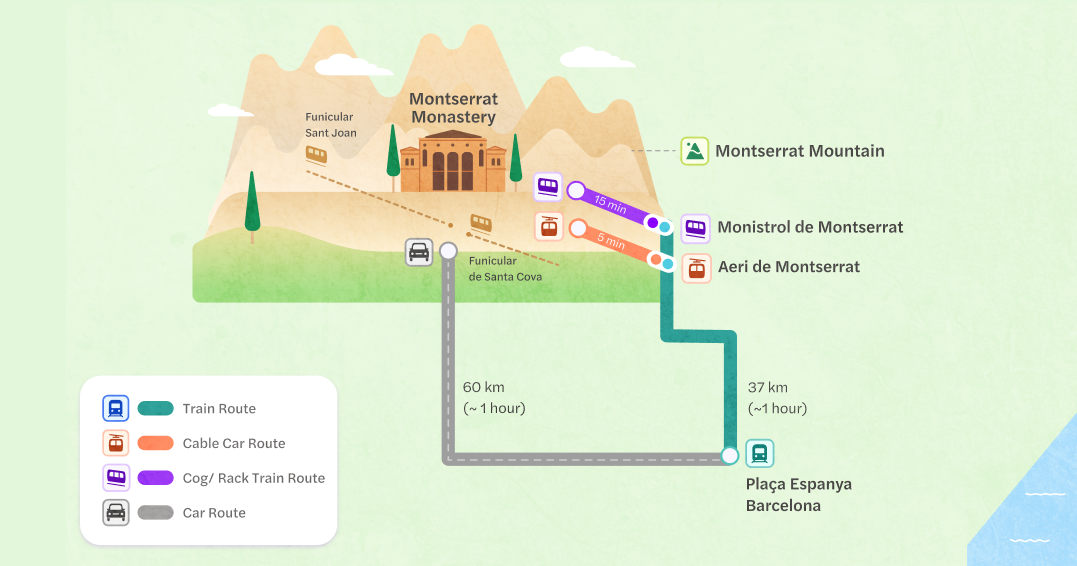
So, we created (C.2) hoping to improve ticket conversions for our Montserrat experience. We incorporated the following to improve it:
- A clear intention for the map. In this case a “how to get there” map
- A consistent visual language to show the transport options
- Presenting only transport related information like travel time, distance, switchovers, terrain information.
- A clean legend
Transforming complex information into simple choices
While we've explored how simplicity and focus can enhance maps for everyday use, these principles don't just apply to simple scenarios. In fact, they become even more crucial when dealing with complex, data-rich maps that need to convey multifaceted information.
The key is to remember that no matter how complex the information, the goal of a map remains the same: to clarify, not to complicate. By applying these principles - focusing on the map's primary purpose, using progressive disclosure, and employing strong visual hierarchy - we can create maps that turn complexity into clarity, making even the most intricate data sets navigable and actionable.
The Japan metro system is a perfect example of how our mapping principles can transform complexity into clarity.
At first glance (D.1), the network seems overwhelmingly complex: multiple intersecting lines, stations with multiple names, and connections to other rail systems. It's a cartographer's nightmare - or perhaps, their ultimate challenge.
Let's apply our key question: "What is the point of this map?"
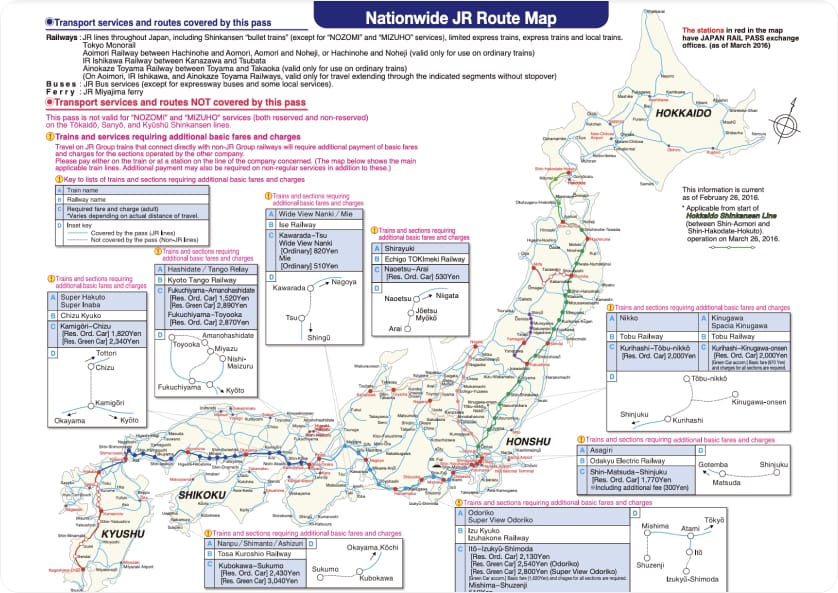
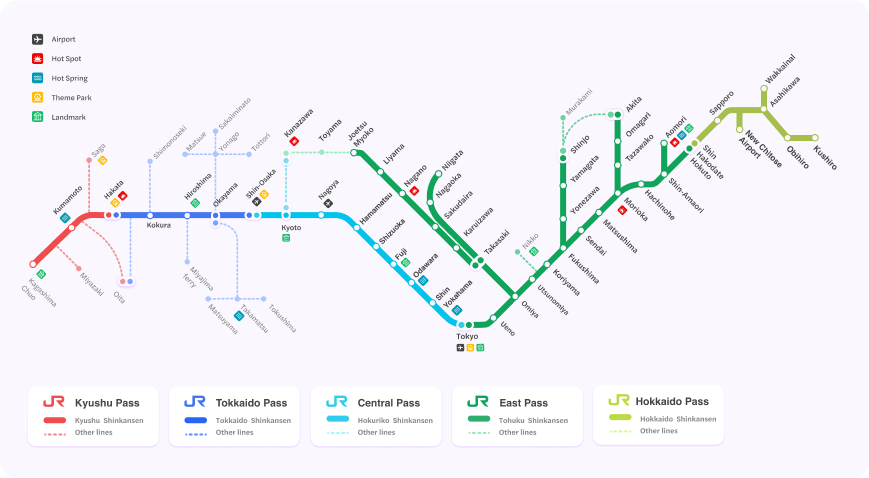
For most users, the primary goal is simple: get from point A to point B efficiently. With so many stops, it’s easy to get lost in the details. With this in mind, we can start to prioritize information to create a simple map (D.2):
- Highlighting the main stops from each region.
- Line colors and station names become our most crucial elements.
- Switchovers between lines need to be clear and prominent.
- The general direction and order of stations are more important than geographic accuracy.
As we continue to navigate an increasingly complex world, filled with ever more data and information, these principles of effective mapping will only become more crucial. They remind us that sometimes, to see the bigger picture, we need to start by showing less.
In the end, the best map is not one that shows everything or nothing at all, but one that shows just enough.
Just like salt: neither too much, nor too little.

A design checklist I like to keep in mind while designing maps:
✅ Is this map simple to consume?
✅ Have I represented the information correctly?
✅ Have I included essential components, like a compass, legend, or scale?
✅ Have I considered the factors that will effect decision making for this map?
✅ Have I included only but all important or useful information?
✅ Is this map legible? Are the fonts, colors, text sizes appropriate for the context?
This blog wouldn't exist without the amazing team behind it. The team is currently working on creating a map design system, to make our customer experience smoother through design experience.
I want to give a big shoutout to Amulya Chintaluri for her editing and content strategy, she made this project more fun.
A big thanks to Ramakrishna V for his constant support and guidance and for making this project a space to learn more. A shoutout to Mukul Chaturvedi & Debanwita for creating this space and motivating me to post this ;)