Nice to meet you, Redis. For the 75,000th time
Sometimes the biggest performance wins come from fixing the simplest problems. This is how we eliminated unnecessary Redis connections and the massive gains that followed.

The curious case of 75,000 Redis connections
It started with a routine on-call alert: our service was suddenly seeing a momentary spike in API failures. As I dug into the issue, I noticed a recurring pattern that our deployments were consistently accompanied by a sharp increase in new Redis connections. One metric in particular stood out where during a short window, our system had created nearly 75,000 Redis connections.
That number felt far too high for what should have been a normal deployment. It’s like we were DDoS-ing ourselves. CPU was healthy, memory was healthy, command latencies were largely acceptable, and it made me curious if a much larger inefficiency was hiding in plain sight.
So why were we creating so many connections? To answer that, let's talk about Restaurants.
Imagine we're running a Restaurant Chain
Suppose we run a large restaurant chain. Customers walk into our restaurants and place orders. Some want soup, some a sandwich and others just a cup of coffee.
Which would translate to:
- Customers are Redis commands.
- Restaurants are our services.
- Redis is the kitchen.
Now, a customer walks in and asks for a bowl of soup. Instead of simply cooking it, we do something absurd.

First, we drive to the grocery store and buy the ingredients, then we buy the plates, bowls and spoons. Once done, then do we actually start cooking the soup. Now here's the interesting part, when the customer finishes eating, we throw away the remaining ingredients, discard the cutlery, and clean out the entire setup.
The next customer arrives, we repeat the entire process from scratch. Again. And again. And again. Every single time!
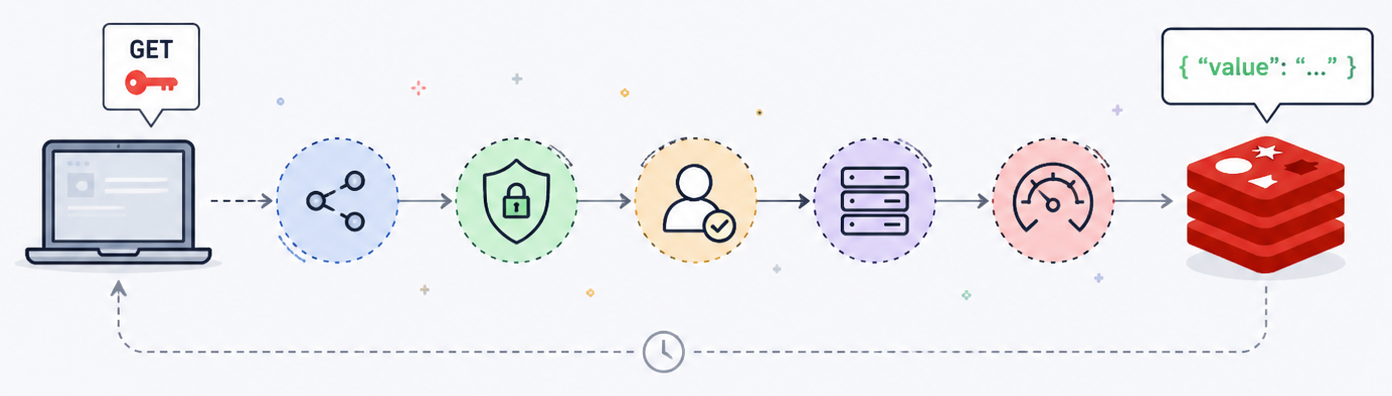
Before a simple Redis GET command can execute, a surprising amount of work happens behind the scenes. A TCP connection needs to be established, TLS handshakes may occur and authentication needs to be completed. Resources need to be allocated on both sides, the internal state needs to be initialised. Only after all that can the actual commands be executed. The query itself is often the cheapest part of the entire operation.
Why Connection Pooling exists
Real restaurants don't buy ingredients for every customer. They maintain inventory, keep plates ready and also keep chefs on shift. They prepare for demand in advance so that serving a customer becomes the only thing that matters.
Even if, "Joey doesn't share food," That's not how the real world works. Businesses survive by reusing shared resources efficiently.
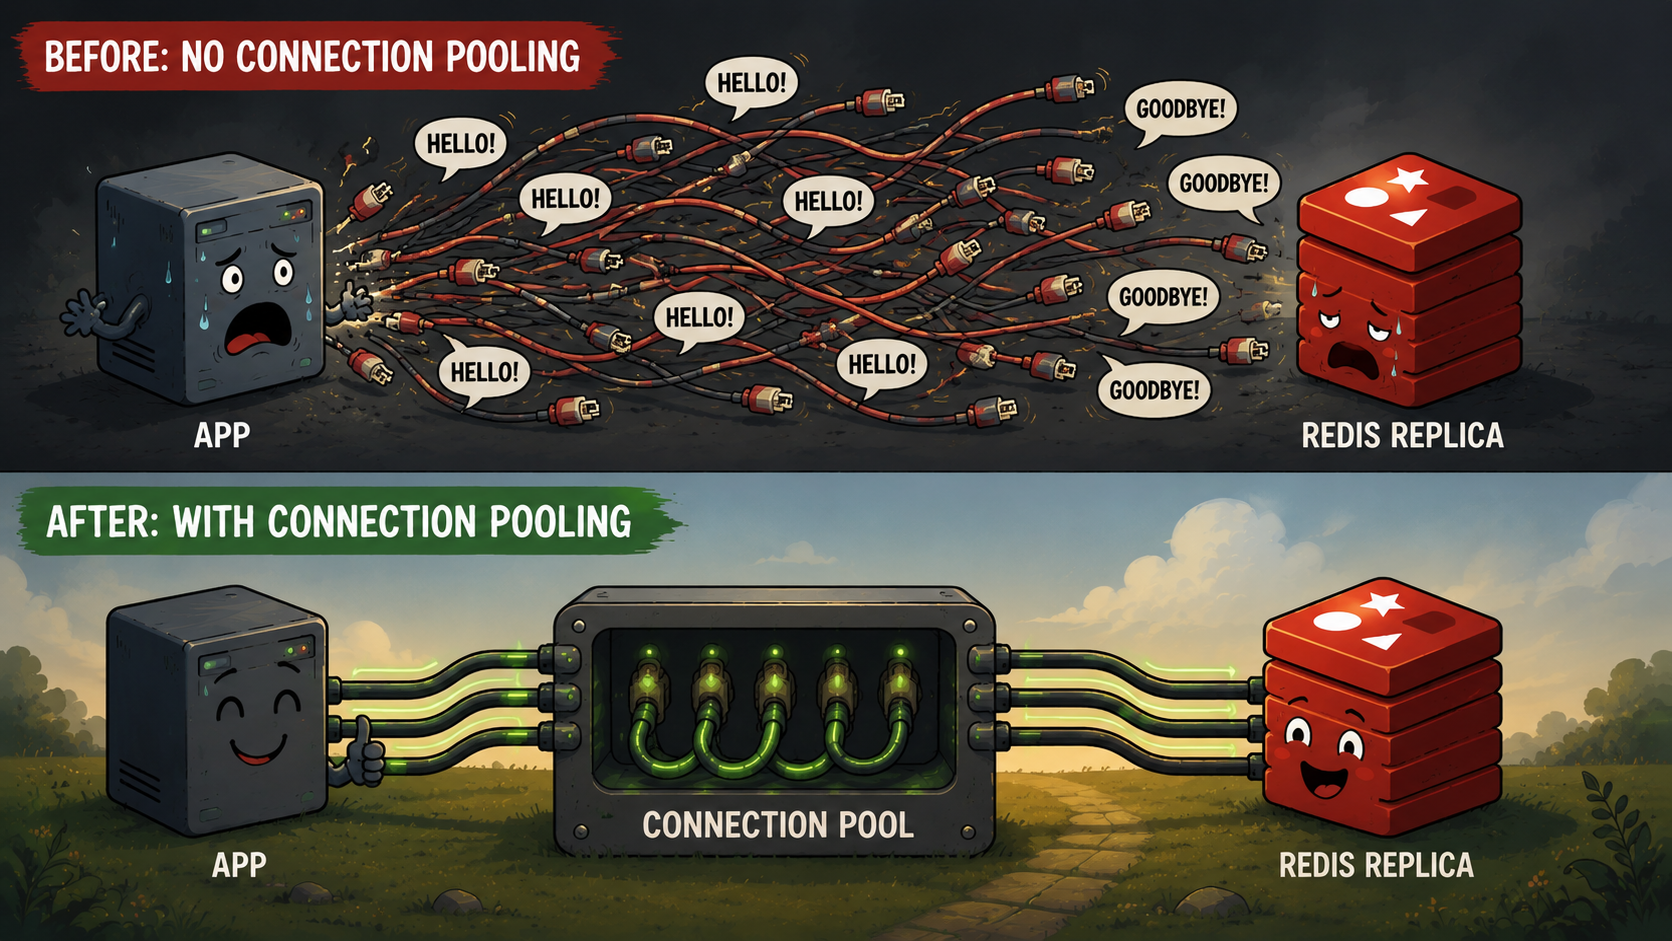
Connection pooling follows the same idea. Instead of spending resources to create a new connection every time a command arrives, we create a small set of reusable connections upfront. Commands borrow a connection, execute their work and return it to the pool. The next command reuses the same connection.
The expensive "hello" happens once and the useful work happens thousands of times.
Identifying our Joey, the root cause
Most of our attention eventually landed on a particular Redis access path using RedisTemplate backed by Lettuce. Every command sent through this path was effectively making another trip to the grocery store. This was the default behaviour defined by the libraries unless pooling configuration was specified.

While current connection counts looked relatively stable, new connection creation rates were enormous. We were creating and then destroying, on average, around 20,000 new connections every minute and around 75,000 at peak during deployments.
Why was this missed until now? Because connection leaks are obvious. Connection churn is sneaky 🥷 hence generally gets ignored. The total connection count can look perfectly reasonable while you're continuously paying the cost of creating and then destroying thousands of connections behind the scenes.
Once we identified this path, the solution was straightforward: introduce connection pooling for both read and write operations across all applications.
The impact was immediate, new connection creation rates dropped from tens of thousands per minute to mere tens per minute. Not because traffic reduced or Redis magically became faster, but because we stopped spamming the repeated hello 👋
Determining the correct pool size
Connection pooling alone doesn't solve the problem. Once you start reusing connections, the next challenge becomes determining how many connections you should keep in the pool which brings us to pool sizing.
Going back to our restaurant analogy, imagine one restaurant is located in a busy city centre and serves thousands of customers per day. Another sits in a quiet suburb and sees only a handful of customers each hour. Would you assign the same number of chefs, waiters, managers and inventory to both locations? Probably not! That's effectively what needs to be done with connection pool size as well.

Some services didn't need the number of idle connections they were maintaining, but there was no way for us to assess this without throttling/breaking our systems by immediately reducing the connection limits. So we started exposing detailed metrics to better visualise the usage patterns 📊
We tracked active connections, idle connections, pending requests, connection creation rates and command latencies across applications and pods. Then we observed for a few days ⏳
To make matters worse, the same service and some other of our services used Redisson as well. The default configuration there was very generous. Connection pools were configured with large minimum idle counts and high maximum limits.
At first glance, this seems harmless. More connections should mean more capacity, right? Not necessarily.
The most useful metric turned out to be pending connections. If requests are waiting for connections, your pool is probably too small. If pending remains zero while most connections stay idle, your pool is probably too large.
Our data consistently showed the latter. Active usage remained extremely low. Pending requests stayed at zero. Large portions of the pools simply sat unused!
This gave us confidence to progressively reduce pool sizes until they matched the actual demand.
The Results
The final configuration changes were surprisingly small.
The impact was not!
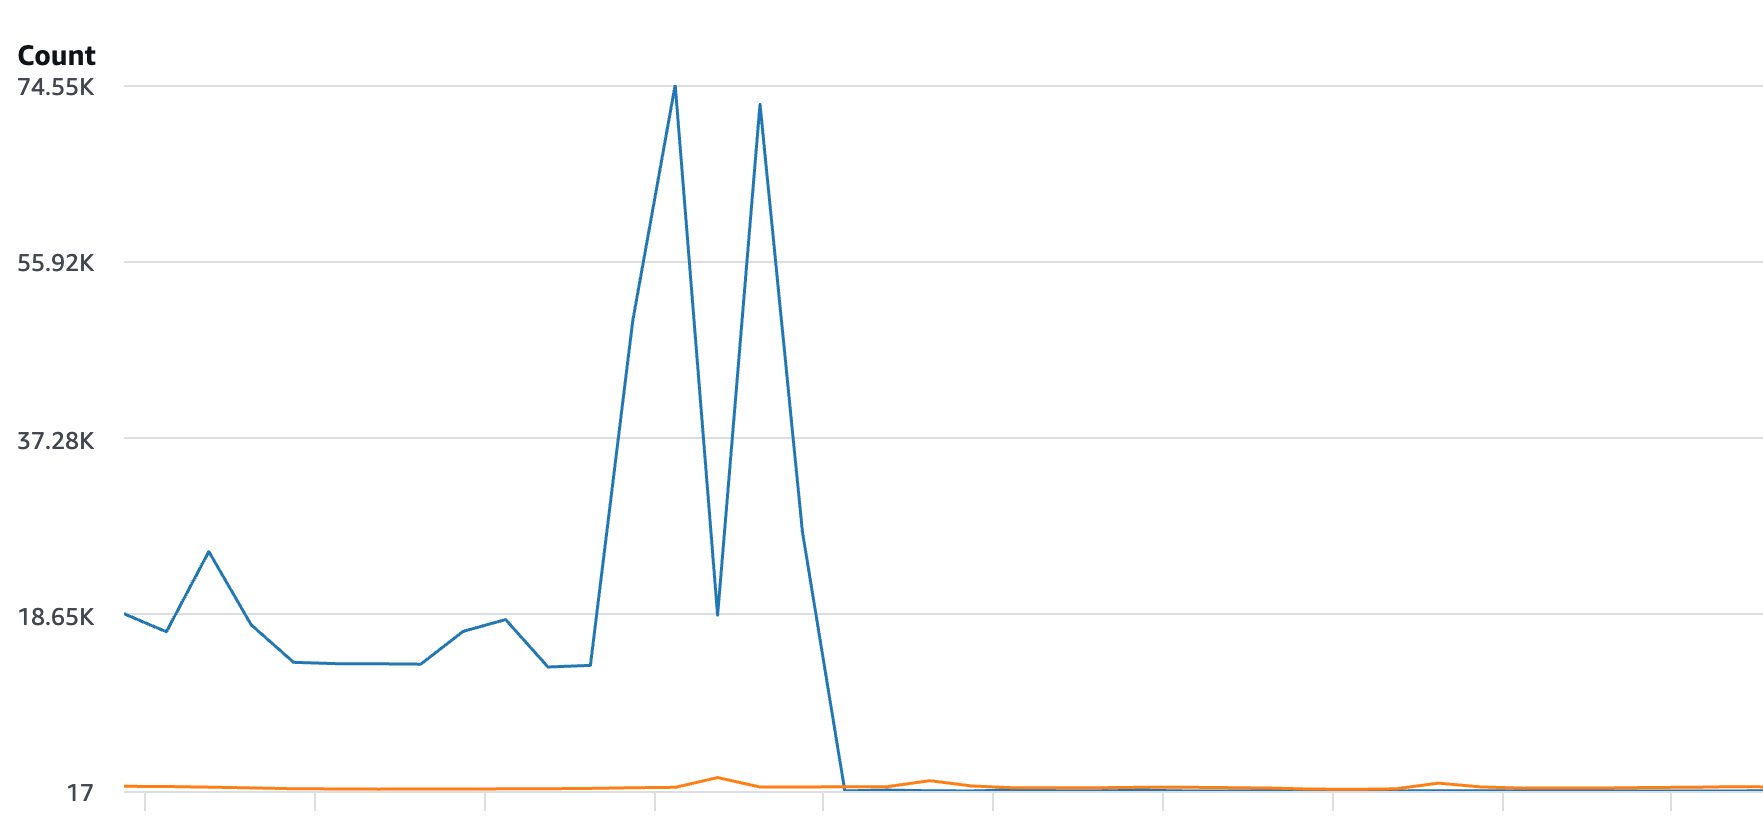
New Redis connections dropped from around 20,000 per minute to roughly 20 per minute. That's a 99.9% drop 🔥
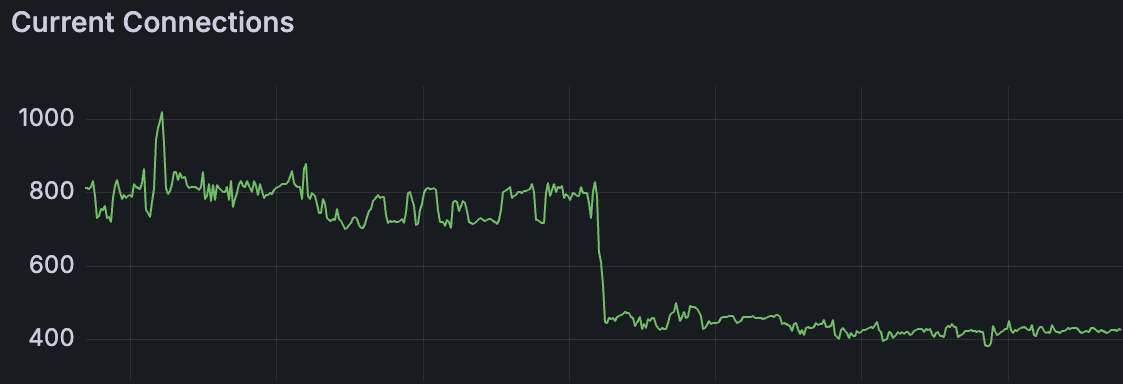
Current connections reduced from roughly 900 to around 500, that's around 55% reduction 📉
More importantly, Redis average GET latency through RedisTemplate halved from around 0.03 ms to 0.015 ms ⚡️, because commands were now using warm, reusable connections instead of repeatedly paying connection setup costs.
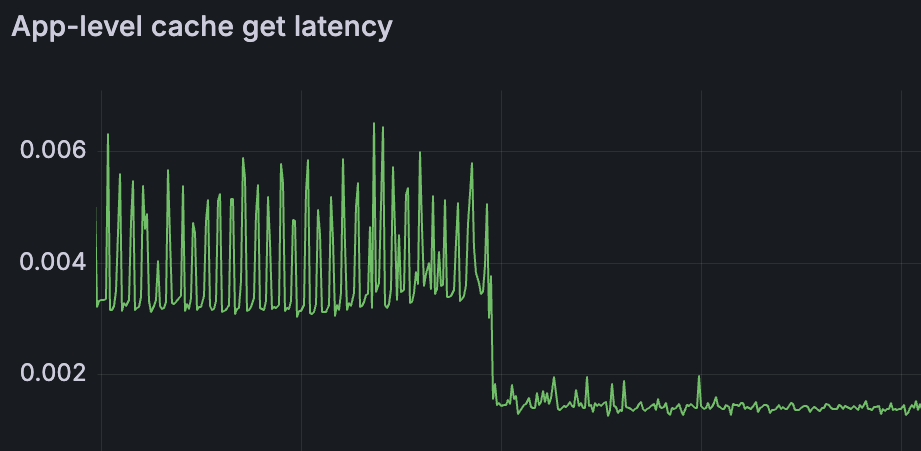
Deployment-time connection spikes disappeared entirely and the recurring "high connection" alerts that had become part of normal operations simply stopped appearing.
The bigger lesson
Connection pooling is one of the first performance concepts most engineers learn. Which is exactly why it gets overlooked!
We assume the problem has already been solved. We assume libraries are configured correctly. We assume defaults match our workloads.
Sometimes they do. Sometimes they don't.
Look at how often you're creating them!
Whether it's Redis connections, database sessions, HTTP clients, threads, or file handles, the fastest resource is often the one you've already paid to create.
Sometimes your database isn't slow.
You're just saying hello too often!