Automating the Chaos: A plugin to track, annotate and organize QA bugs
Design QA was a tedious task—until we decided otherwise. In this article, I’ll walk you through our journey of creating a Figma plugin that transforms bug tracking into an efficient process.

If you stumbled onto this blog without reading the last one, or think design QA automation is just a "nice-to-have" rather than a must, hit pause and read the previous post first. Mukul nailed it, explaining why an efficient process for Design QA is necessary and how we have started optimizing design QA at Headout. If you’ve never worked with Figma APIs before and need a detailed guide to help you build your first plugin, check out our blog on the Wavy Lines Plugin.
Now that we’re all on the same page—or even if we aren’t—let’s dive in!
Recap
At Headout, we tackled the chaos in our Design QA process, testing and refining what actually works for us. Previously, feedback was scattered across Slack messages, screenshots, and Loom videos, creating loops and delays. Through trial, we built a standardized framework with clear annotations and a central QA table to track issues by device, page, and status. This structure has made feedback specific, actionable, and easy to reference, cutting down miscommunication and streamlining collaboration between designers and developers. Key takeaways are:
We want to have numbered annotations,
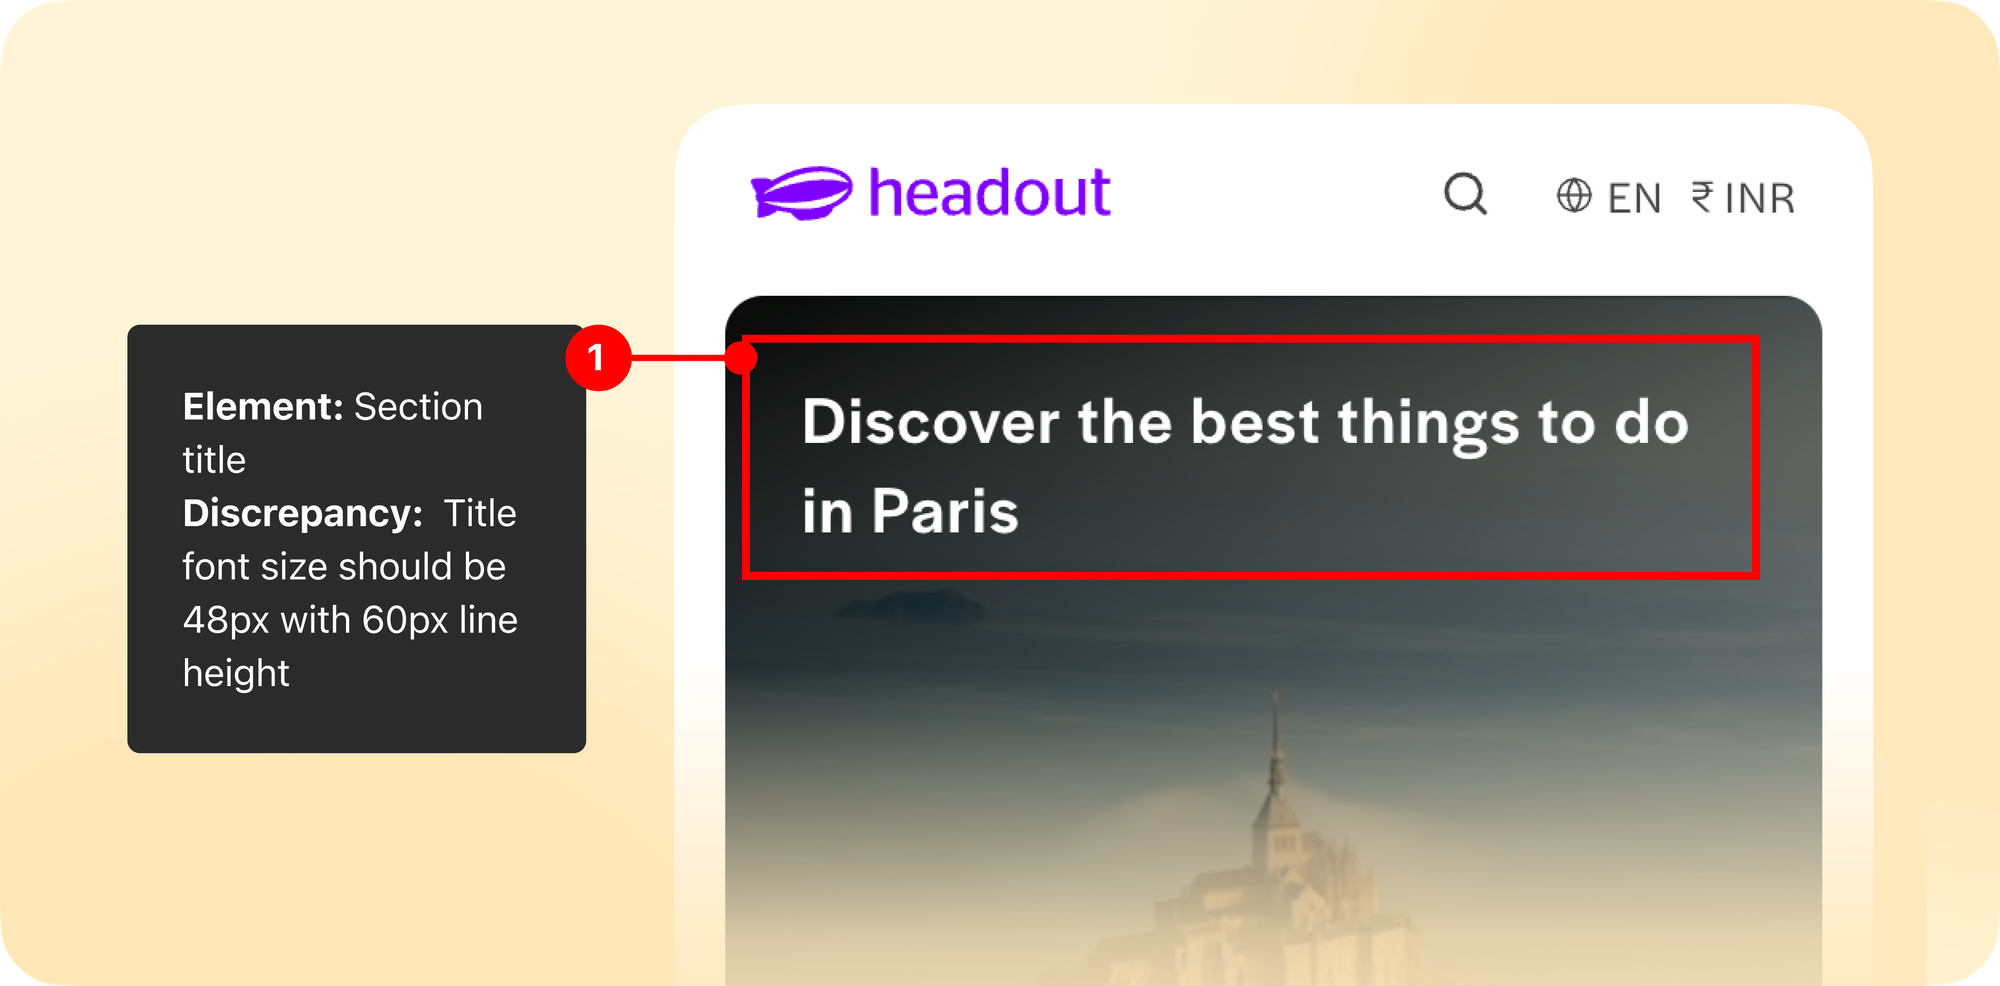
- and a tracker for bug details with their current status.
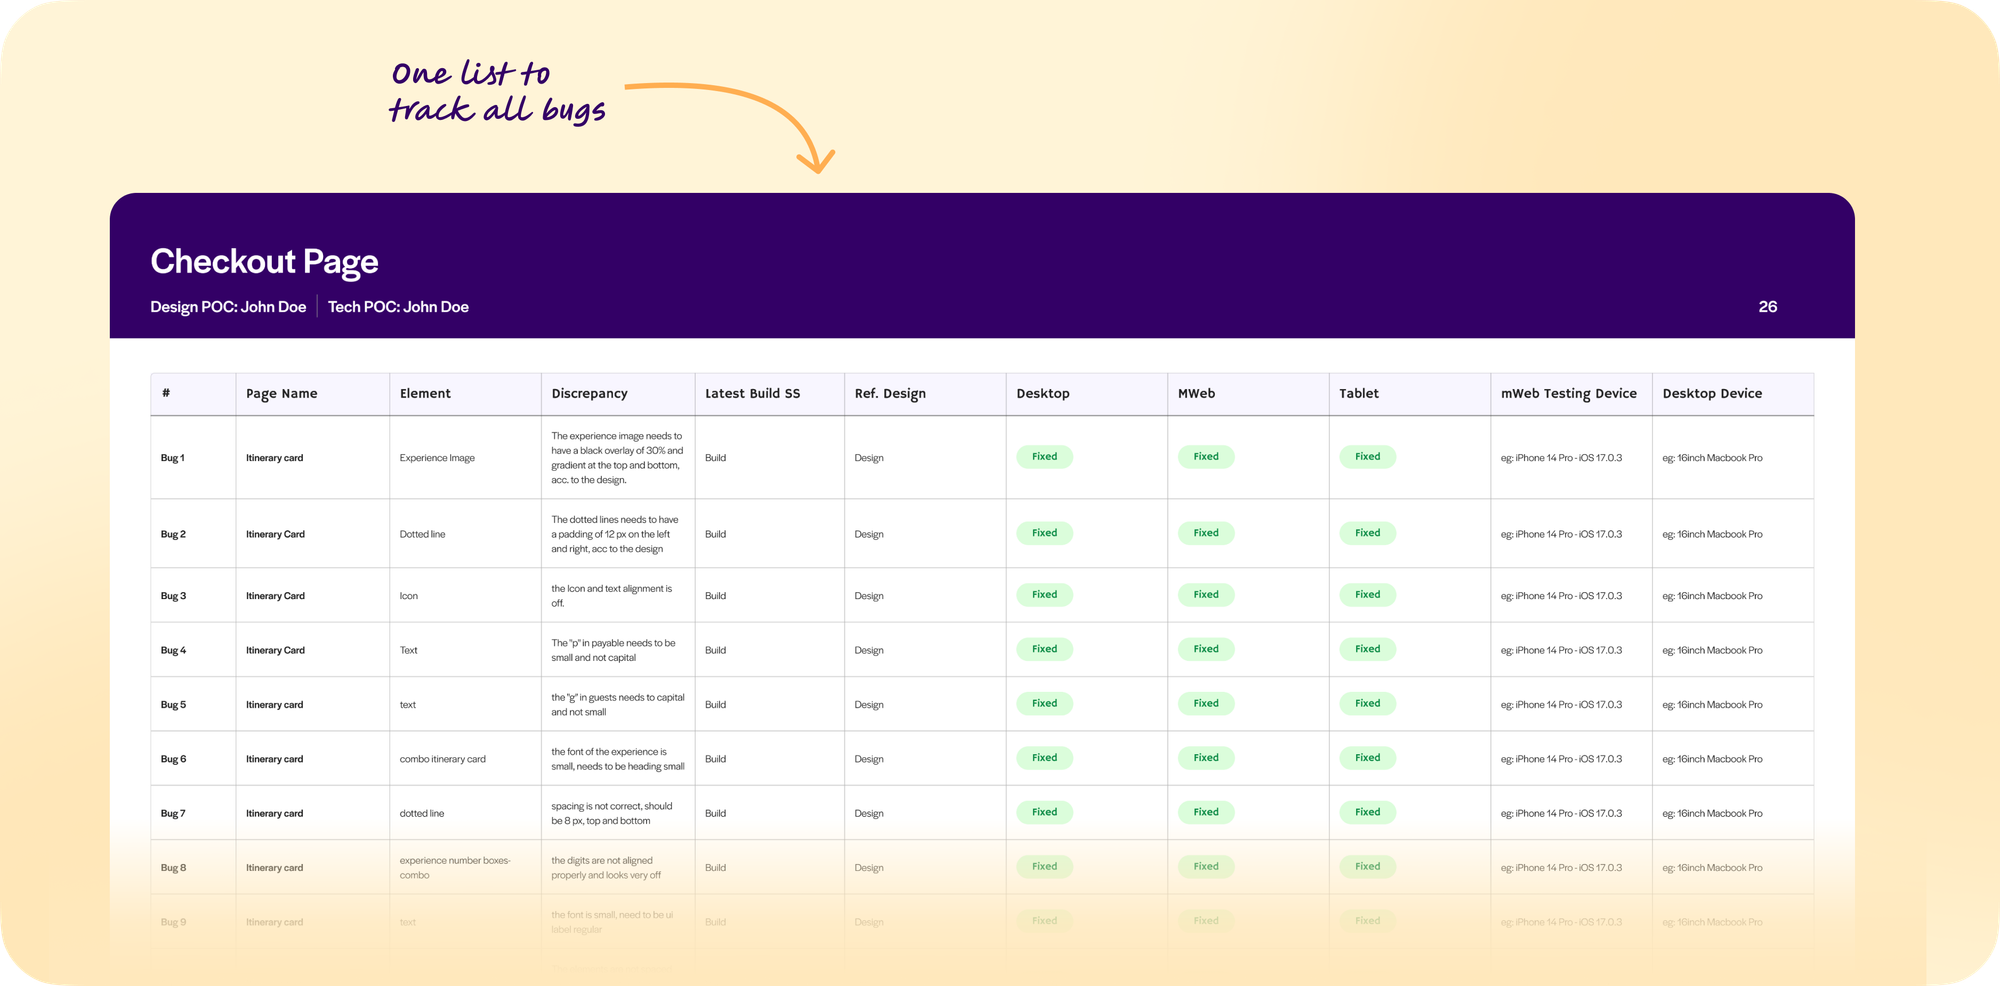
- We realized that manually updating said tracker and bug count is a delightful ride straight to nightmare island. Each time we add an annotation, we're forced to detour to the tracker, re-enter every detail, and then trek back to the QA section to repeat the process. It’s an exhausting, rinse-and-repeat cycle that drains time and patience, and is quite frankly, burdensome.
- The rule is clear: if something can be automated, and we’re doing it manually, we’re breaking the laws of efficiency.
Which basically meant that we had direction, but what we craved was the quick thrill of automation.
Why should devs have all the fun?
Sure, "devs and fun" may sound like an oxymoron, but dev-tooling is an exception—especially with endless customizations and automations at your fingertips. Every project management tool from Jira to Linear and even Slack plays nice with GitHub. But Figma? It still gets the guest treatment. So, in true Headout spirit, we built our own automation instead.
Trial and Error
Turns out, asking ChatGPT to “build a Figma plugin that displays a form, copies a tracker template from another file, creates a new row in it, and annotates my current selection” doesn’t exactly go as planned. You’ll get a monstrous block of valid-looking gibberish, complete with a bonus 3-page-long error message. Tempted to debug it? Don't. No seriously, don’t. Here’s what we learned the hard way…
Figma plugins can't span files. A plugin can only access nodes on the same file.
This meant that a simple CTRL + C and CTRL + V on a template kept in a different file isn’t feasible. So, our quick fix? Build the whole template from scratch in code. Our 10-line plugin idea quickly ballooned into a full-fledged project. With reading glasses on and sleeves rolled up, we began sifting through the Figma docs.
It finally dawned on us that coding every single frame manually will take us eons. To illustrate my point, here’s the code to create one frame:
// Create FRAME
 const issueFrame = figma.createFrame()
 container.appendChild(issueFrame)
 issueFrame.resize(253, 71)
 issueFrame.primaryAxisSizingMode = "AUTO"
 issueFrame.counterAxisSizingMode = "AUTO"
 issueFrame.name = "Issue"
 issueFrame.fills = [{"type":"SOLID","visible":true,"opacity":1,"blendMode":"NORMAL","color":{"r":0.16832682490348816,"g":0.1678035408258438,"b":0.1678035408258438}}]
 issueFrame.cornerRadius = 4
 issueFrame.paddingLeft = 24
 issueFrame.paddingRight = 24
 issueFrame.paddingTop = 10
 issueFrame.paddingBottom = 10
 issueFrame.primaryAxisAlignItems = "CENTER"
 issueFrame.counterAxisAlignItems = "CENTER"
 issueFrame.strokeTopWeight = 1
 issueFrame.strokeBottomWeight = 1
 issueFrame.strokeLeftWeight = 1
 issueFrame.strokeRightWeight = 1
 issueFrame.clipsContent = false
 issueFrame.expanded = false
 issueFrame.layoutMode = "VERTICAL"
And here’s how to create one Text node:
// Create TEXT
 const issueLabel = figma.createText()
 issueFrame.appendChild(issueLabel)
 issueLabel.resize(205, 17)
 issueLabel.name = `Element: ${annotationLabel}`
 issueLabel.fills = [{"type":"SOLID","visible":true,"opacity":1,"blendMode":"NORMAL","color":{"r":1,"g":1,"b":1}}]
 issueLabel.relativeTransform = [[1,0,24],[0,1,10]]
 issueLabel.x = 24
 issueLabel.y = 10


 // Font properties
 issueLabel.fontName = {
   family: "Manrope",
   style: "Regular"
 }
 issueLabel.characters = `Element: ${annotationLabel}`
 issueLabel.listSpacing = 0
 issueLabel.lineHeight = {"unit":"PERCENT","value":139.9999976158142}
 issueLabel.textAutoResize = "HEIGHT"
Unsurprisingly, we decided to stop re-inventing the wheel and turn to solutions online. Salvation came in the form of another plugin - Node Decoder by Gavin MnFarland. I dedicate this blog to this gem of a plugin, which cut down dev time by 80%. Node Decoder generates plugin or widget source code from any Figma design as Javascript and JSX. And that’s exactly what we needed.
If you’re also planning to use node decoder, we found that it doesn’t work that well with hidden nodes, complex groups and masking.
We simplified our design structure, which not only reduced load but made it play nice with Node Decoder. From here on, whenever we mention "creating" a design, we’re really talking about building a reference version and feeding it into Node Decoder. Every tweak happened on top of that foundation. With the design ready and a quick way to turn it into code, all that was left was connecting the dots. Here’s the breakdown:
The UI
Nothing fancy—just one huge HTML file. However, for reference, after a couple facelifts, here’s the current version -
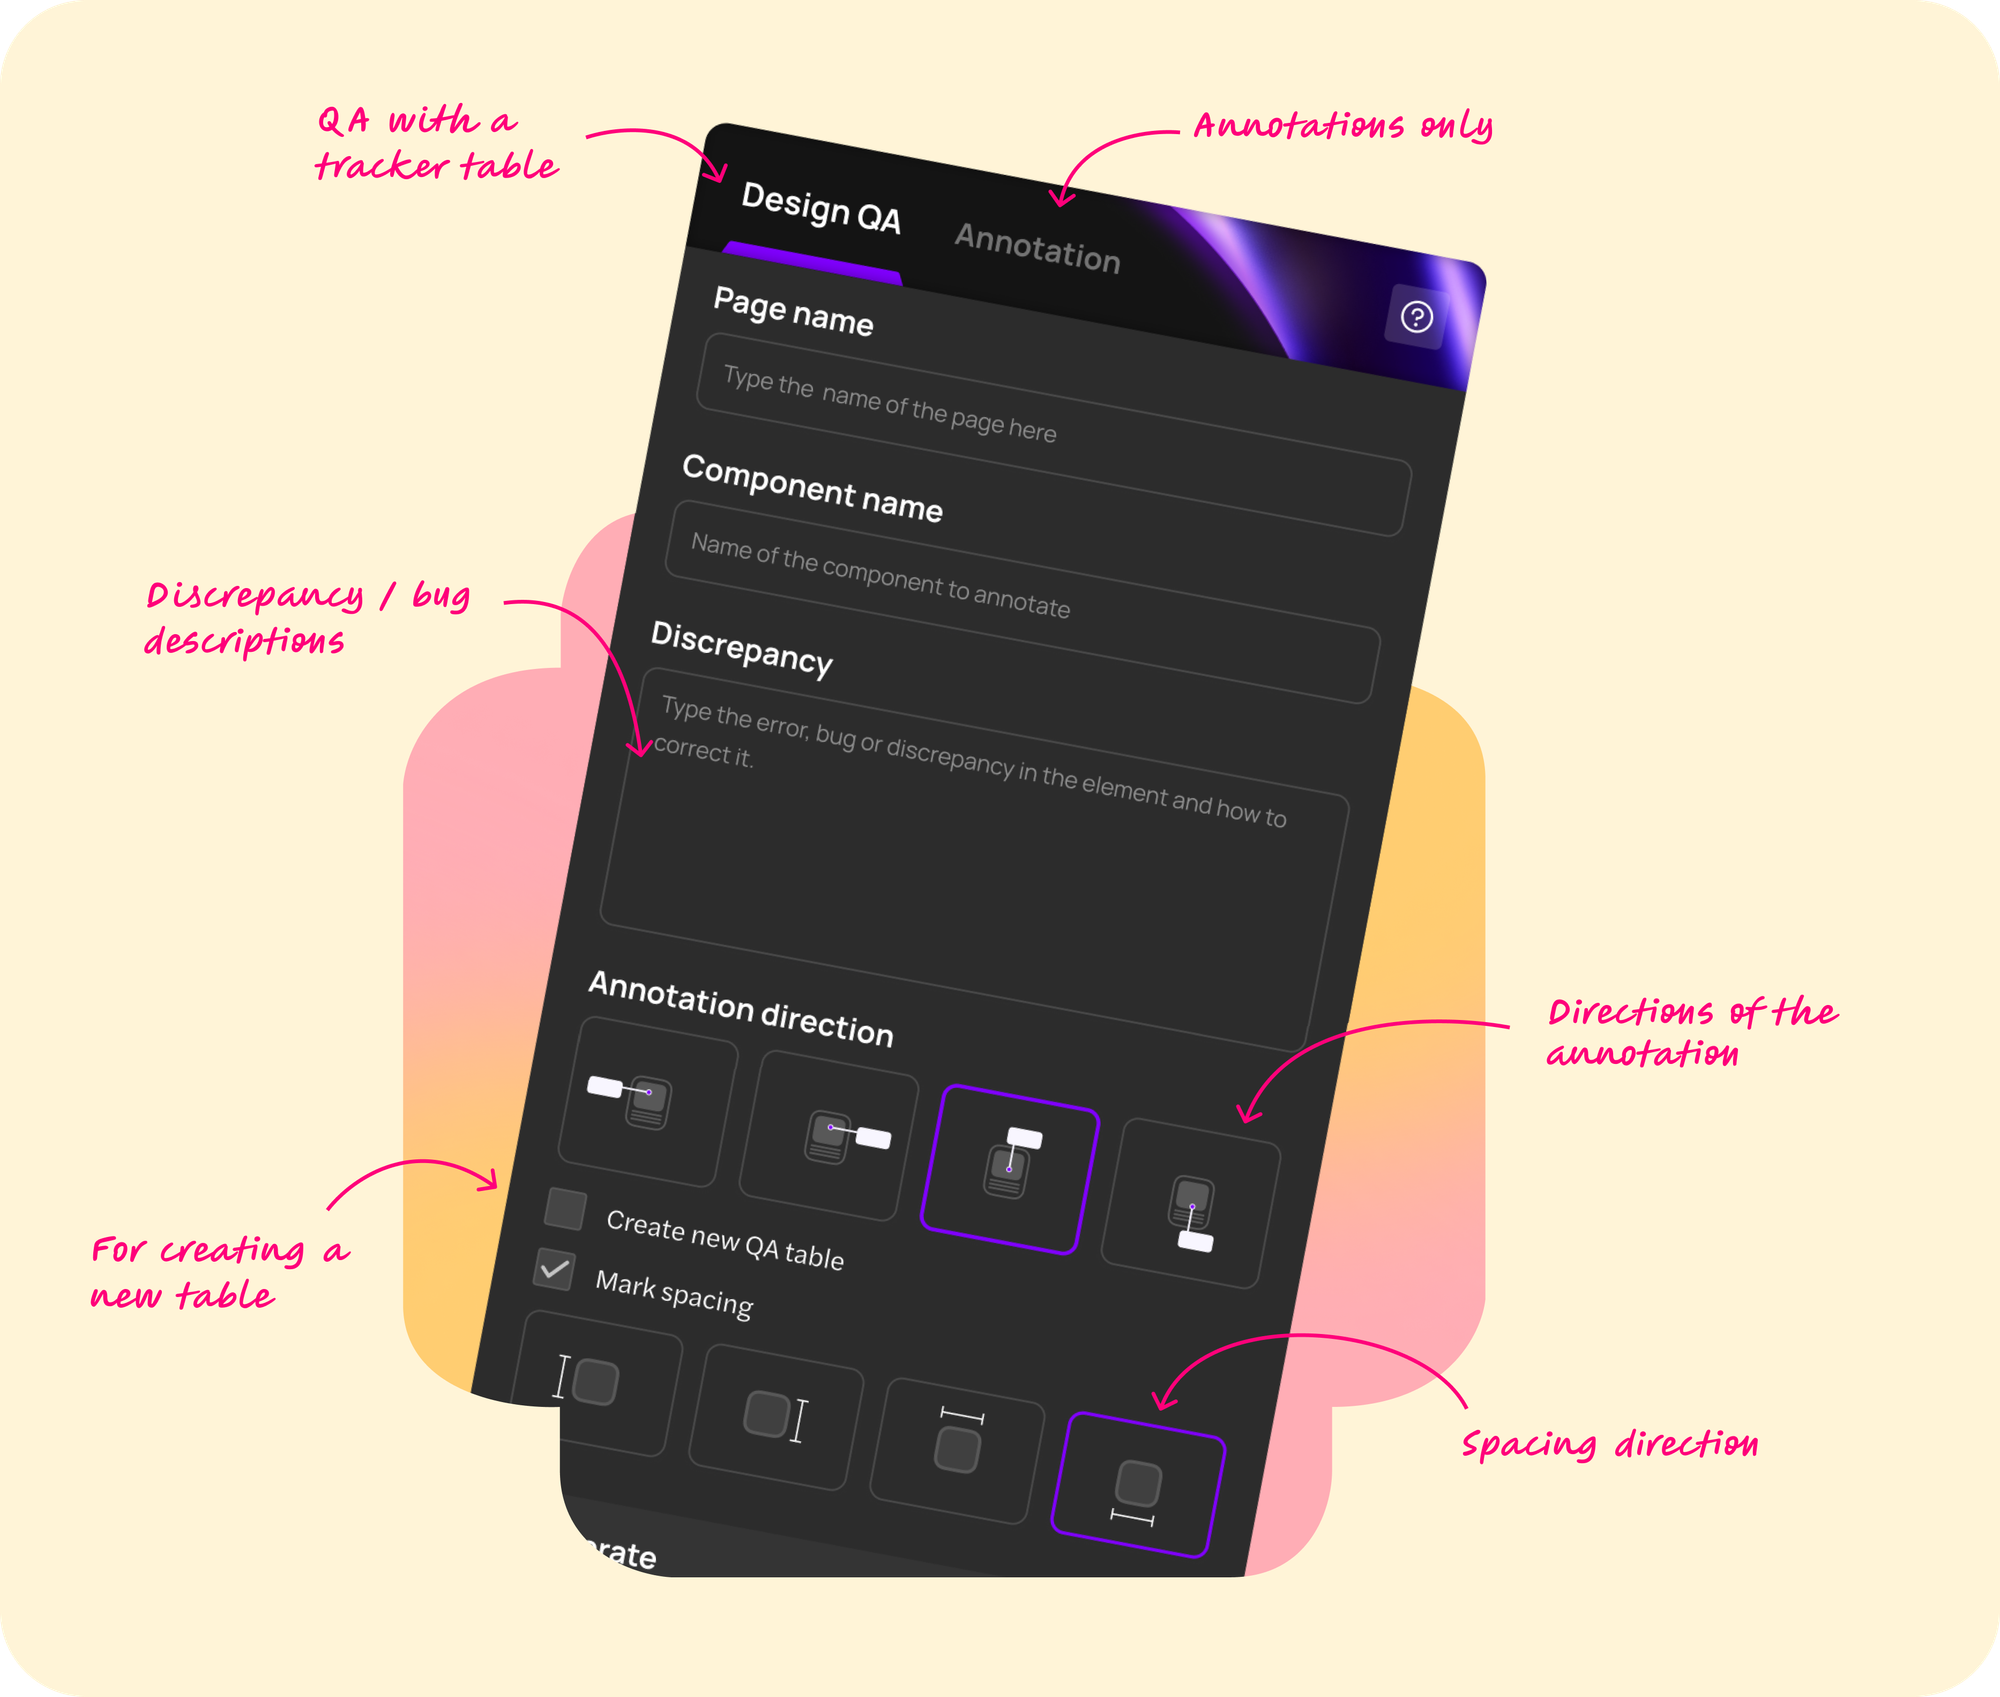
There is a small catch here.
All of the UI has to fit into one file (ui.html) to work by default. This means we can’t separate HTML, CSS, and JS into different files outright.
However, if we want to segregate our styling and scripts and/or include other packages, we will need to bundle our code.
Running a counter:
Keeping track of the bug number in the annotations clearly meant running a counter. Initially, we wanted to use the plugin data API, which would store data within the node. It’s a small piece of code that looks like this:
bugCountText.setPluginData("bugCount", "0")It also makes searching for a node in the file pretty quick.
const globalCounter = figma.currentPage.findAllWithCriteria({
         pluginData: {
           keys: ["bugCount"]
         }
})
Later, we realized we wanted to create multiple tracker sheets for different QA rounds within the same file, with separate ‘annotation’ and ‘design QA’ modes, each having their own running counters.
We tackled this in two parts:
- When in ‘annotation’ mode, we maintain a hidden global counter in the corner of the file that keeps track of the bug count.
- In ‘design QA’ mode, we maintain a counter for each tracker sheet directly on the sheet.
Annotations:
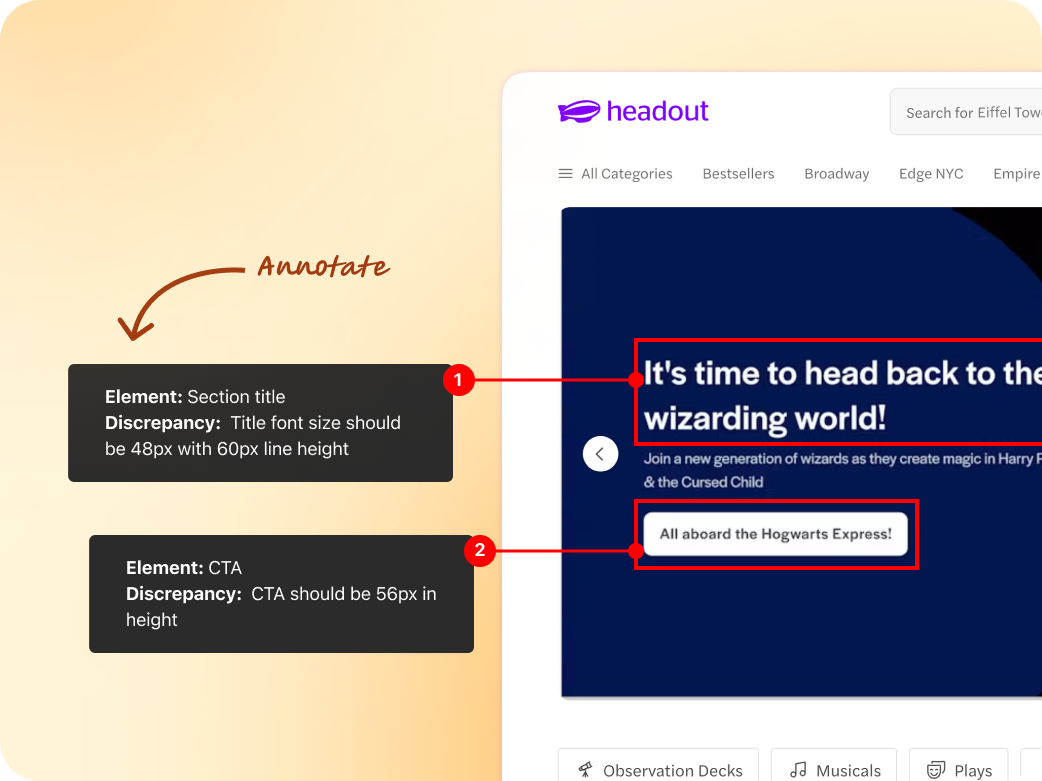
This was a combination of node decoder, and a little math. The annotation unit is divided into 3 parts -
- The box:
- To run the plugin, we first create a frame/rectangle on the area we want to annotate. This conveniently gives us the coordinates for making the box. After that, we simply replace the reference frame with a transparent one.
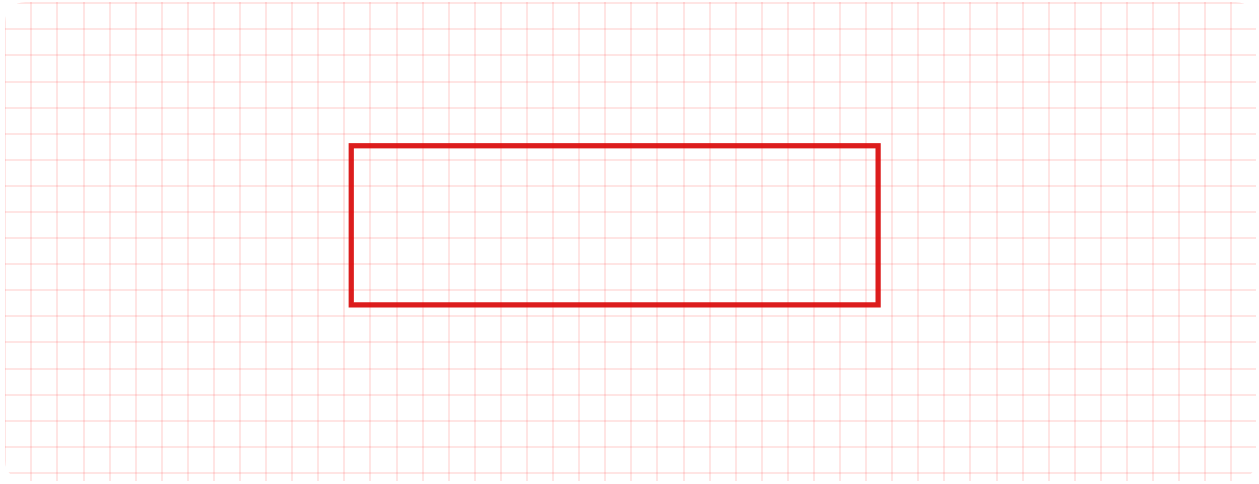
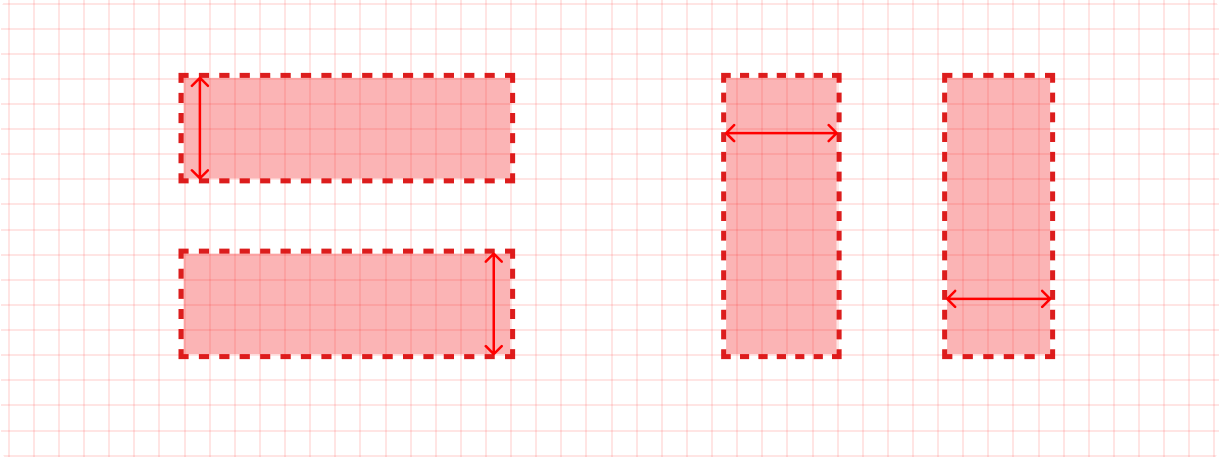
- If we’re marking a spacing issue, we give it a dashed pattern, fill it in, and create an arrow in the selected direction.
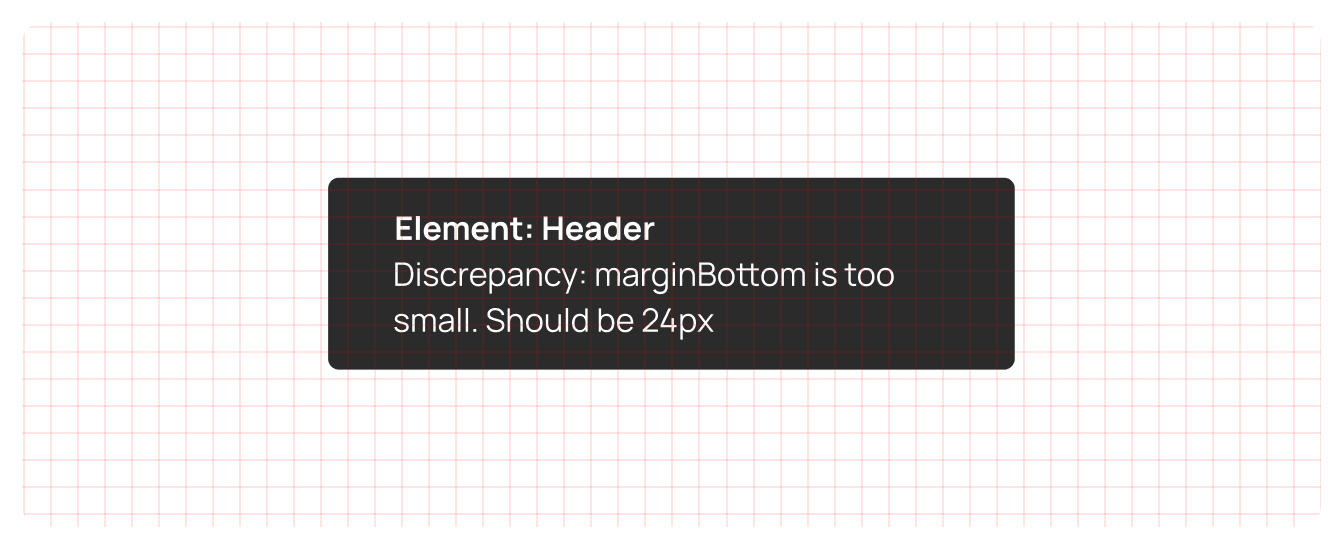
- Issue text:
A simple frame with two text fields filled by form input.
- Connector and Counter:
Positioning this was a slightly tricky. It took two frames—connector and counter—stacked in an auto layout that shifted based on the chosen direction. This setup let us place the annotation and issue frames in any of the four cardinal directions.
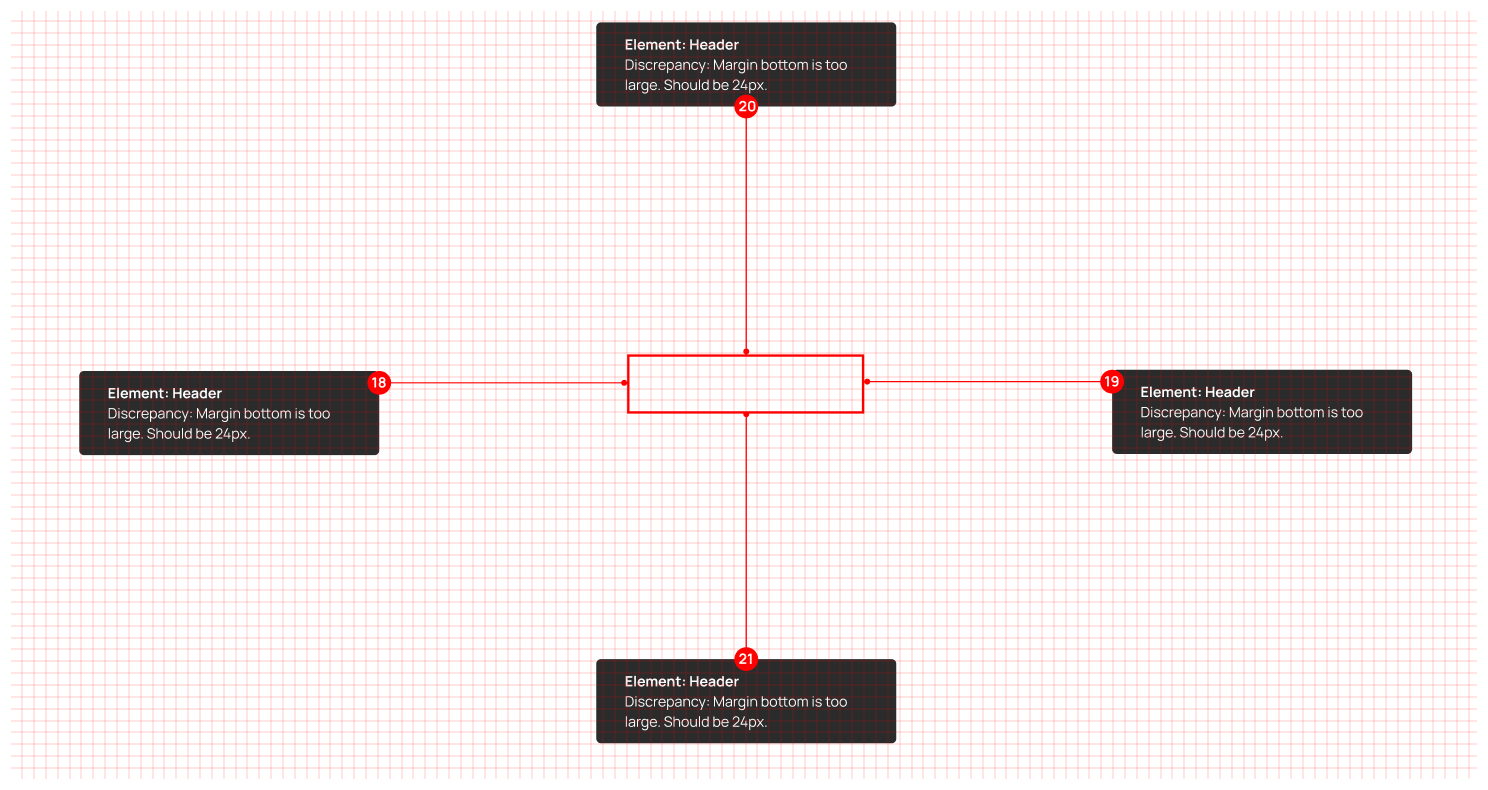
Separating the issue description and the annotation box also gave us the flexibility to move the description from the center easily, creating space for multiple adjacent annotations. This meant we could adjust placements effortlessly:
So far, so good? Once you get the hang of Figma APIs, this all feels pretty straightforward. But that was just the warm-up—we still had to tackle the real beast.
The tracker:
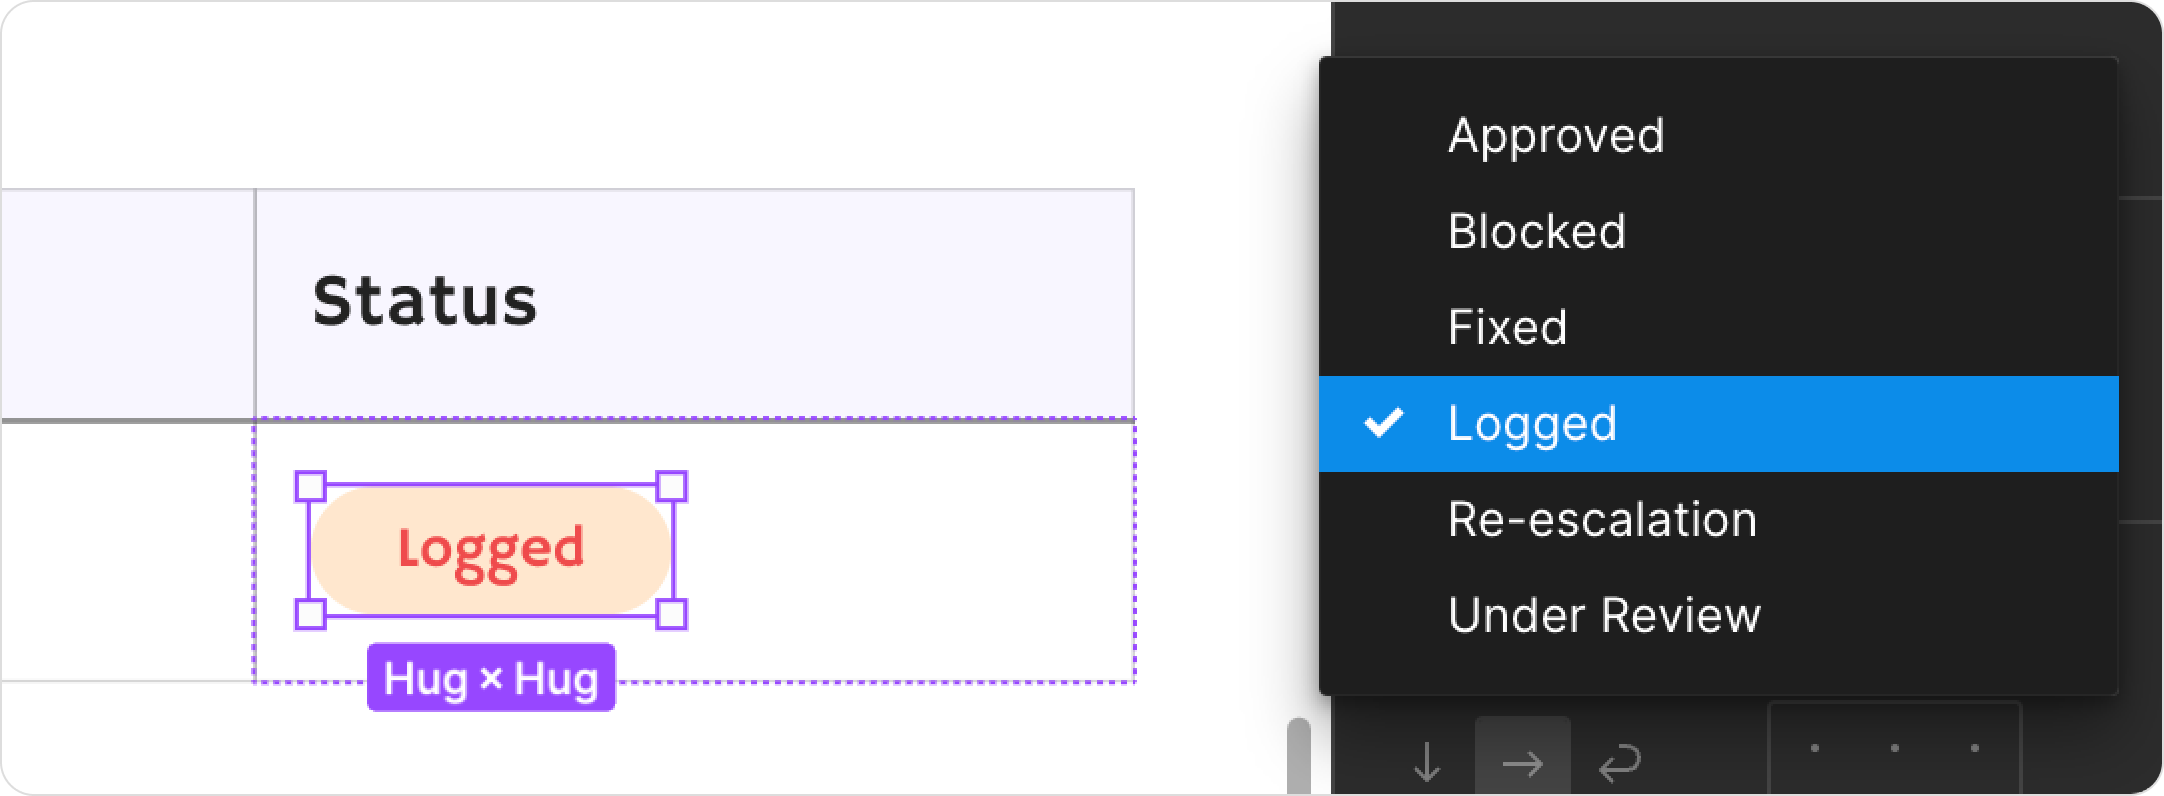
Looks simple, but creating this involved more iterations than I’d care to admit. Here’s how it works: the first time we run the plugin, or when we check the ‘create new tracker’ box, it generates a new tracker with a basic UI, default values, and a single entry. We place it slightly off from the selected frame to avoid overlapping with annotations, and each new bug frame stacks below it. For each new tracker, we also generate a component set for possible bug statuses.
The result after the first run looks something like this:

Node decoder struggles with component sets. If you want to create one on your own, following the Figma API reference is faster than debugging.
Let’s walk through creating a simple component set. It's going to be slightly code-heavy, and we'll start with creating two status variants:
createStatusFrame : (status:string) => FrameNode // assuming createStatusFrame() has already been written

// we start with creating two different frames with their own styling
const fixedStatusFrame = createStatusFrame("Fixed")
const blockedStatusFrame = createStatusFrame("Blocked")

// then we'll convert both of them into component nodes
const fixedStateComponent = figma.createComponentFromNode(fixedStatusFrame)
const blockedStateComponent = figma.createComponentFromNode(blockedStatusFrame)

// next, we'll name the component nodes that we just created
fixedStateComponent.name = "Fixed"
blockedStateComponent.name = "Blocked"

// and then squash them into a list
const statusComponents = [fixedStateComponent, blockedStateComponent]

// finally, we'll use the list to make a component set. statusContainer should be a blank frame that we'll use to drop the component set in
const statusComponentSet = figma.combineAsVariants(statusComponents, statusContainer)
We now have a simple component set. But it wouldn't appear stacked up like in the image just yet. To align the variants vertically:
 statusComponentSet.layoutMode = "VERTICAL"
 statusComponentSet.counterAxisSizingMode = "AUTO"
 statusComponentSet.itemSpacing = 20
Next, we can link the set to the bug frame in the tracker with plugin data,
statusComponentSet.setPluginData("status", "Logged")to make it easier to grab later
const statusComponentSet = figma.currentPage.findAllWithCriteria({
   pluginData: {
     keys: ["status"]
   },
 })
This sets up everything we need to use this set later. While adding a new row to our tracker, we'd create a status component instance and attach it to our frame:
const defaultStatusVariant = (statusComponentSet[0] as ComponentSetNode).defaultVariant
const statusInstance = (defaultStatusVariant! as ComponentNode).createInstance();
currentStatus.appendChild(statusInstance);
statusInstance.swapComponent(defaultStatusVariant! as ComponentNode);
If everything went properly, we'd be able to adjust the live status of each bug individually. In the final setup, we extended our status component to have 6 variants instead of just 2.
And that’s a wrap! We’ve now fully automated the process of creating an annotation frame, logging it into a tracker, and having it all neatly organized for easy reference.
While a dev might have a minor heart attack on opening the QA file and finding this behemoth:
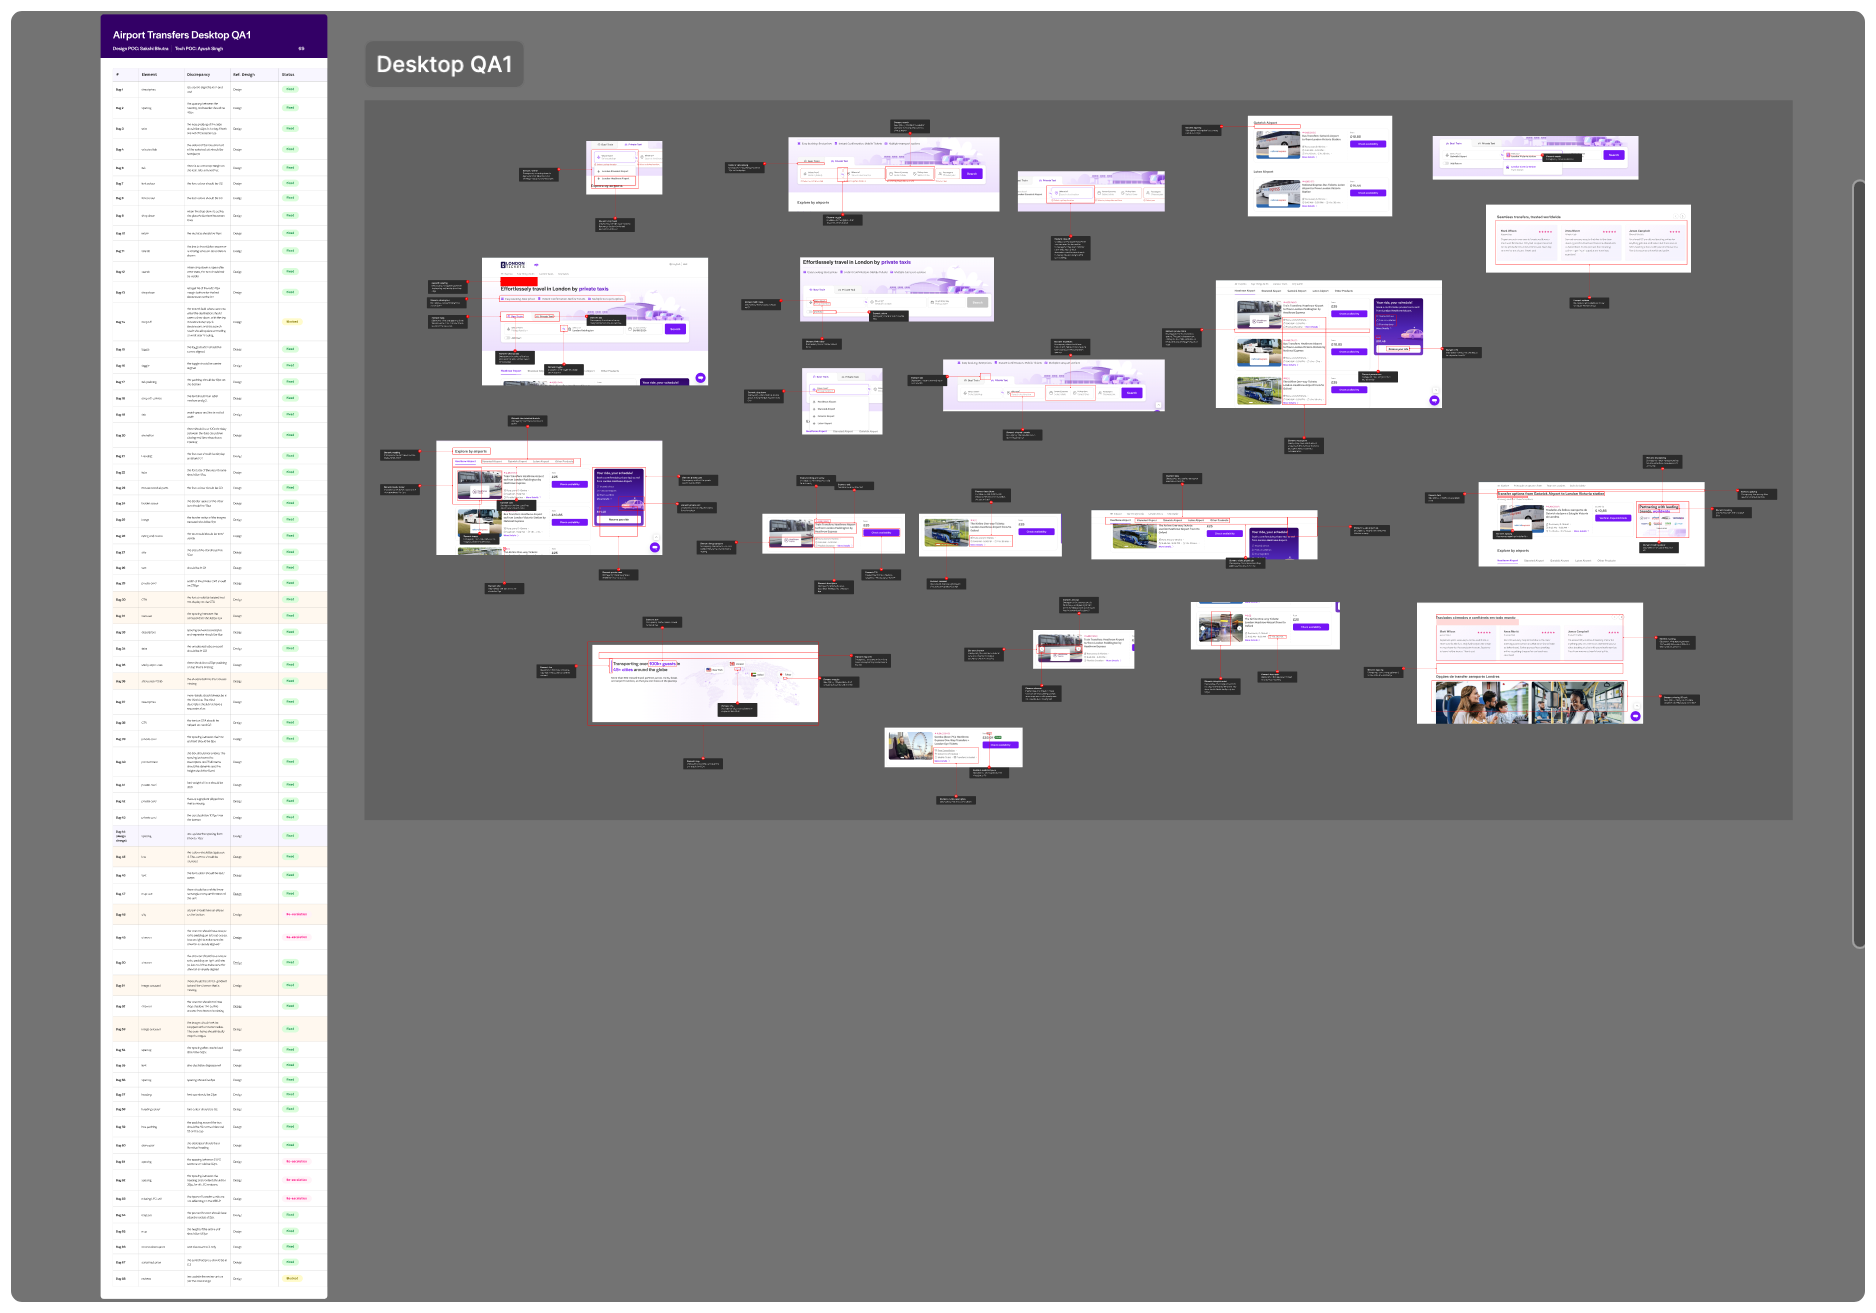
It’s perfectly organized chaos, and it’s oddly satisfying to know that annotating the bugs took no longer than finding them in the first place.
Check out the plugin here: Design QA: Identify, Annotate, and Track (We’re open to any questions, suggestions or feedback!)
Acknowledgements:
To Ramakrishna and Mukul - this plugin is their brainchild, with Mukul’s design transforming haunting bug lists into a visually satisfying experience.
And to you - if you made it this far, you deserve a coffee. Or, you know, a new plugin to try out ᵔ ᵕ ᵔ

